
Statistics Canada
www.statcan.gc.ca
Common menu bar links
Science and technology

Archived Content
Information identified as archived is provided for reference, research or recordkeeping purposes. It is not subject to the Government of Canada Web Standards and has not been altered or updated since it was archived. Please contact us to request a format other than those available.
Scientific innovation has transformed our lives in ways our grandparents likely never imagined. At home, work and play, yesterday’s marvels are today’s commonplaces. We reheat last night’s dinner in the microwave and have injuries repaired with microsurgery, we share documents as easily with colleagues across the globe as with those in the next office, we go online to find the lyrics to our favourite song or the partner of our dreams. Small wonder, then, that the Organisation for Economic Co-operation and Development (OECD) tells us innovation is integral to competitiveness and national progress.
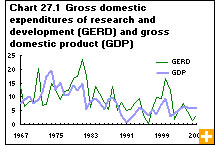
The OECD says innovative effort, including formal research and development, is the indispensable element of growth. That’s why most OECD countries have invested more rapidly in knowledge than in machinery and equipment since the mid-1990s. Canada sits in the middle of the pack of the 30 OECD member nations in terms of gross domestic expenditures on research and development (R&D) as a percentage of gross domestic product (GDP). Canada invested nearly 2% of GDP on R&D in 2007; Sweden posted the highest percentage in the OECD, more than 4%. The United States invested slightly more than 3%.
Who’s taking part?
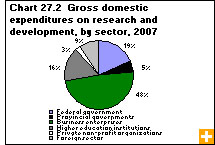
Canada’s domestic spending on R&D neared $29.0 billion in 2007, according to preliminary figures, compared with just over $16.0 billion in 1998. That investment comes from businesses, governments, universities, private non-profit groups, institutions of higher education and foreign sources.
The business sector is the biggest R&D player in Canada, investing $13.8 billion in 2007, almost half of the total. The federal government places second, at $5.4 billion, or 19% of all R&D funding, according to 2007 preliminary figures. R&D investment intentions in 2007/2008 were 2.9% of the total federal government’s budget. While this is down from the 3.3% peak in 2005/2006, it is still ahead of the 2.1% that was invested in the mid-1990s.
Business also performs the majority of R&D in Canada—in 2007, the value of business-performed R&D was $15.8 billion, more than half of all R&D undertaken. Together, business and higher education perform about 90% of the country’s R&D year after year. The higher education sector, which includes all affiliated research hospitals, experimental stations and clinics, undertook $10.4 billion worth of R&D in 2007. The federal government, Canada’s other major R&D force, conducted $2.3 billion worth of R&D in 2007, primarily at the National Research Council, Agriculture and Agri-FoodCanada, National Defence and Natural Resources Canada.
What’s being researched?
R&D spending falls into two major categories: natural sciences and engineering, and social sciences and humanities. In 2007, of the $28.9 billion invested, $26.7 billion went to natural sciences and engineering; $2.2 billion was spent in the social sciences and humanities. This funding allocation is consistent with previous years.
Research in the health sector takes the lion’s share of Canada’s total R&D spending, accounting for $6.6 billion in 2006, up 6.8% from 2005. This was slightly more than 23% of all R&D spending, compared with 17% a decade earlier. By far the largest proportion, 63%, of health sector research was conducted by the higher education sector.
In the business sector, six industries led in performing R&D: information and cultural industries, communication equipment, scientific research and development, computer system design and related services, pharmaceutical and medicine manufacturing, and aerospace products and parts manufacturing. Together they accounted for one-half of the estimated $15.8 billion worth of R&D performed in the sector in 2007.
Who’s in the science workforce?
While a country’s innovation climate—one of the key elements for economic health, growth and international competitiveness—is often gauged by the proportion of the GDP devoted to research and development, that’s not the only measure.
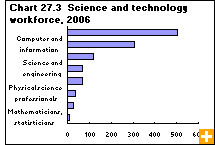
Another measure of the economic resources devoted to innovation is the size of an economy’s science and engineering workforce. Comparing Canada and the United States, the size of the science and engineering workforce in the two countries is proportionally very similar—and it has been that way for the past 30 years. In 2001, the science and engineering workforce comprised 13.6% of total employment in both countries.
The workforce measured includes two groups: a core group, made up of computer and mathematical scientists, life scientists, physical scientists, social scientists and engineers; and a related group made up of workers in health-related occupations, as well as science and engineering managers, science and engineering technologists, other science and engineering workers, and postsecondary educators in science and engineering fields.
The Canada–U.S. percentages are still comparable if just the core group of scientists and engineers is counted: in both countries it equalled 4.5% of total employment in 2000/2001. However, there are differences. In Canada one-quarter of scientists and engineers work in the professional, scientific and technical industries, compared with one-fifth in the United States. In the United States, however, scientists and engineers make up 8.1% of manufacturing employment, compared with 4.8% in Canada.
