
Canadian and U.S. Prices, 1985 to 2011Note 1

Archived Content
Information identified as archived is provided for reference, research or recordkeeping purposes. It is not subject to the Government of Canada Web Standards and has not been altered or updated since it was archived. Please "contact us" to request a format other than those available.
by Mélanie Meunier, National Economic Accounts Division and Beiling Yan, Economic Analysis Division
![]()
Start of text box
This Economic Insights article presents new data on the relative prices of Canadian and U.S. products, focusing on various classes of goods and services. It also evaluates the extent to which changes in these relative prices correlate with movements in the nominal exchange rate. The comparative price estimates are based on data from Statistics Canada’s Purchasing Power Parity program.
End of text box
The appreciation of the Canadian dollar post 2000 sparked renewed interest in the size of the difference in the prices paid for consumer goods in Canada and the United States. At issue is whether Canadian consumers pay more than U.S. consumers for standardized products that are traded freely between the two countries, such as books, electronic equipment and automobiles, even after the Canada–U.S. exchange rate is taken into account. To study this issue, this article examines whether the exchange-rate-adjusted prices that Canadians pay for a wide range of products equate with U.S. prices—do they obey ‘the law of one price’?Note 2
Data on Canadian and U.S. prices
The estimates presented here complement recent work on Canada–United States price levels that examined a less-detailed set of commodities for which information on cross-border prices is readily available.Note 3 The tabulations are derived from a Statistics Canada database that comes from a joint Canada–United States statistical program used to produce price comparisons between the two countries at an aggregate level.Note 4 The results in this report use detailed price information on more than 150 commodity groups,Note 5 representing a cross-section of goods and services sold by industries that are mainly in the private sector.Note 6
The commodity groups considered in this article are divided into two basic classes, goods and services. Goods might be influenced more strongly by the economic forces that adjust prices on both sides of the border because, potentially, they are subject to more arbitrage than are services. Within the goods class, commodities are divided into alcohol and tobacco consumer products; consumer food products affected by marketing boards or supply management; other consumer products; and investment goods. Thus, the commodities are differentiated, first, by their principal user (consumer goods purchased by households versus investment goods purchased by firms) and, second, by the degree to which final prices are likely to be affected by arbitrage. (Less arbitrage is anticipated for consumer products whose production and trade are affected by regulation—such as alcohol, cigarettes, poultry, milk, cheese, butter and eggs).Note 7
Measuring the Canadian price relative to the U.S. price
The course of relative prices between the two countries, since the mid-1980s, is examined here using the ratio of the final selling price in Canada to the final selling price in the United States, adjusted for differences in the Canada–U.S. exchange rate: this ratio is called the ‘comparative price level’ (CPL).Note 8 These are the final prices paid by consumers, including all taxes and margins.Note 9 In a later section, estimates of taxes are removed for comparisons in two recent years.
The CPL that is reported here indexes the U.S. selling price to 1.0. It provides an estimate of the percentage difference in the Canadian price against this baseline. For example, if the CPL for a particular product is 1.2, the Canadian price is 20% above the U.S price level after adjusting for the exchange rate; conversely, a CPL of 0.8 indicates that the exchange-rate-adjusted Canadian price is 20% below the U.S. price level.Note 10
Weaker Canadian dollar—lower relative Canadian goods prices
Median CPLs are produced for all commodity groups for the 1985-to-2011 period.Note 11 They are plotted in Chart 1, along with the US$–CAN$ nominal exchange rate. The depreciation of the Canadian dollar from 1990 to 2002 was accompanied by progressively lower relative prices in Canada.
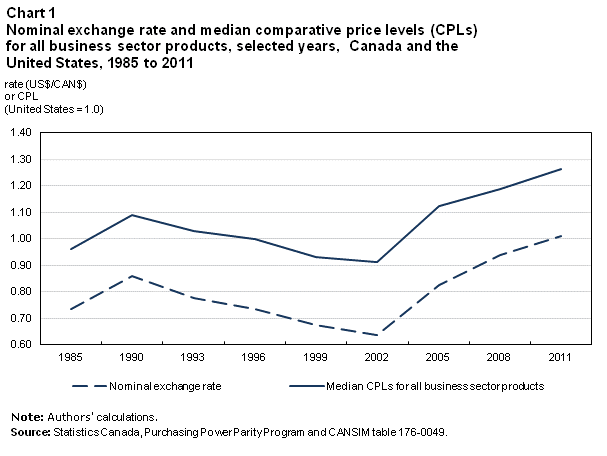
This suggests that the loss of Canadian purchasing power during these years because of the depreciation of the Canadian dollar was not fully passed on to Canadian consumers in the form of higher relative prices. The median CPL for all commodities fell from 109% of the U.S. price level in 1990 to 91% in 2002. Thereafter, as the exchange rate appreciated, the median CPL rose, reaching 126% of the U.S. price level in 2011. This means that the appreciation of the Canadian dollar was not fully passed on during this period.
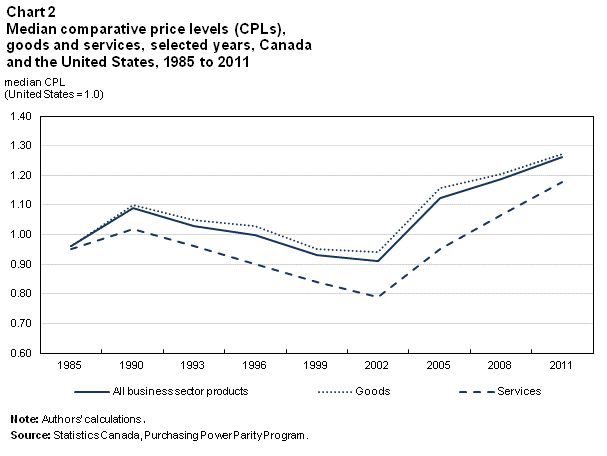
The median CPLs for both goods and services are plotted in Chart 2. On balance, the course followed by the median CPL for each broad product class closely mirrors that of the aggregate. Median CPLs declined for both goods and services during the 1990s. The median CPL for goods in Canada was 10% above the U.S. price level in 1990, when the exchange rate stood at US$0.86 per Canadian dollar. In 1999 and 2002, when the exchange rates were US$0.67 and US$0.64, respectively, the median CPL for goods in Canada was below the U.S. price level. The median CPL of services followed a similar pattern during these years: median CPL in Canada fell to about 80% of the U.S. price level by 2002.
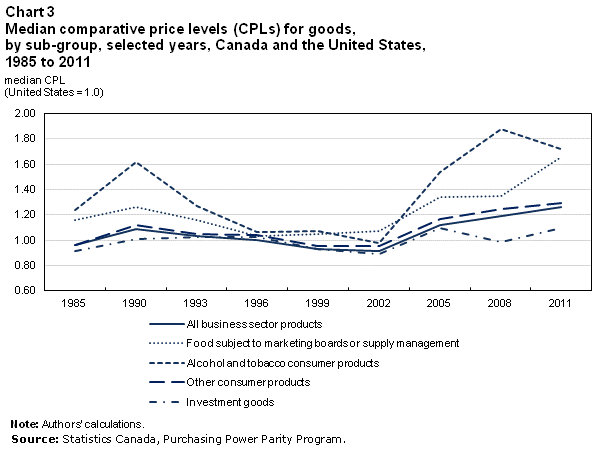
In Chart 3 and Table 1, the median CPL estimates for goods are divided into the four subgroups: alcohol and tobacco consumer products; consumer food products affected by supply management or marketing boards; other consumer products; and investment goods. During the 1990s, the decline in the median CPL estimates for investment goods and ‘other’ consumer products closely tracks the overall estimate for goods. The median CPL of alcohol and tobacco products and products affected by marketing boards or supply management also declined with the depreciation of the Canadian dollar. In the early 1990s, the median CPLs for these products were higher than for other consumer products. For example, in 1990, the median CPL of alcohol and tobacco products in Canada was 62% higher than the United States price level; by 2002, with a much weaker Canadian dollar, median CPLs were equivalent on both sides of the border.
| 1985 | 1990 | 1993 | 1996 | 1999 | 2002 | 2005 | 2008 | 2011 | |
|---|---|---|---|---|---|---|---|---|---|
| rate (US$/CAN$) | |||||||||
| Nominal exchange rate | 0.73 | 0.86 | 0.78 | 0.73 | 0.67 | 0.64 | 0.83 | 0.94 | 1.01 |
| CPL (United States = 1.0) | |||||||||
| Median comparative price level | |||||||||
| All business sector products | 0.96 | 1.09 | 1.03 | 1.00 | 0.93 | 0.91 | 1.12 | 1.19 | 1.26 |
| Goods | 0.96 | 1.10 | 1.05 | 1.03 | 0.95 | 0.94 | 1.16 | 1.20 | 1.27 |
| Consumer products | 0.97 | 1.14 | 1.07 | 1.04 | 0.96 | 0.96 | 1.21 | 1.27 | 1.31 |
| Food subject to marketing boards or supply management | 1.16 | 1.26 | 1.16 | 1.03 | 1.05 | 1.07 | 1.34 | 1.35 | 1.66 |
| Alcohol and tobacco consumer products | 1.24 | 1.62 | 1.27 | 1.06 | 1.07 | 0.98 | 1.54 | 1.88 | 1.72 |
| Other consumer products | 0.96 | 1.12 | 1.05 | 1.04 | 0.95 | 0.95 | 1.17 | 1.24 | 1.29 |
| Investment goods | 0.91 | 1.01 | 1.02 | 1.02 | 0.93 | 0.89 | 1.10 | 0.99 | 1.09 |
| Services | 0.95 | 1.02 | 0.96 | 0.90 | 0.84 | 0.79 | 0.95 | 1.07 | 1.18 |
| Note: Authors' calculations. Source: Statistics Canada, Purchasing Power Parity Program and CANSIM table 176-0049. |
|||||||||
Stronger dollar—higher Canadian goods prices
With the emergence of a stronger dollar in recent years, the median CPL of goods in Canada rose from 94% of the U.S. price level in 2002, when the dollar was at US$0.64, to 127% in 2011, when the dollar was at US$1.01. The median CPL of services also rose—from 79% of the U.S price level in 2002 to 118% in 2011.
After 2000, considerable differences appeared in the growth of the relative price levels in the various goods sub-groups. The relative price level of other consumer products (products other than alcohol and tobacco, and food products affected by marketing boards or supply management), was 17% higher than the U.S. price level in 2005, 24% higher in 2008, and 29% higher in 2011. The median CPL of investment goods fluctuates around a level that roughly equates prices in both countries: rising from 2002 to 2005, and after 2008, fluctuating around parity. By contrast, large relative price increases for alcohol and tobacco products in 2005, 2008 and 2011 brought the median CPL of these products up from rough equality in 2002 to 72% above the U.S. price level in 2011. For consumer food products affected by marketing boards or supply management (e.g., goods such as poultry, eggs and milk), the median CPL was 34% above the U.S. price level in 2005, 35% higher in 2008, and 66% higher in 2011.
Effects of removing sales taxes from final selling prices
The previous analysis is based on final selling prices that include sales tax. To see whether differences in tax rates affect the CPLs presented earlier, we removed the estimates of average sales taxes from categories in both countries and calculated median CPL before and after sales taxes for 2005, 2008 and 2011 (Table 2). Removing sales taxes generally does not greatly affect the comparisons. For example, the median before-tax CPL of all business sector products in 2011 was 22% above the U.S. price level; with taxes included, it was 26%. Cross-country differences in sales taxes only contributed 4 percentage points to the 26% after-tax gap. The alcohol and tobacco consumer products group contains products for which sales and excise taxes are more important—where differences in sales taxes contribute to around an 8-percentage-point increase in the CPL: the median CPL rose from 164% before tax to 172% after tax in 2011.
Changes in sales taxes do not affect changes in CPLs over time. The median Canadian after-tax prices relative to the United States for all business sector products rose 14 percentage points from 2005 to 2011, and the before-tax relative prices rose 12 percentage points.
| Without tax | With tax | |||||
|---|---|---|---|---|---|---|
| 2005 | 2008 | 2011 | 2005 | 2008 | 2011 | |
| CPL (United States = 1.0) | ||||||
| All business sector products | 1.10 | 1.18 | 1.22 | 1.12 | 1.19 | 1.26 |
| Goods | 1.13 | 1.20 | 1.23 | 1.16 | 1.20 | 1.27 |
| Consumer products | 1.15 | 1.26 | 1.28 | 1.21 | 1.27 | 1.31 |
| Food subject to marketing boards or supply management | 1.34 | 1.35 | 1.66 | 1.34 | 1.35 | 1.66 |
| Alcohol and tobacco consumer products | 1.42 | 1.79 | 1.64 | 1.54 | 1.88 | 1.72 |
| Other consumer products | 1.13 | 1.24 | 1.25 | 1.17 | 1.24 | 1.29 |
| Investment goods | 1.10 | 0.99 | 1.09 | 1.10 | 0.99 | 1.09 |
| Services | 0.95 | 1.06 | 1.19 | 0.95 | 1.07 | 1.18 |
| Note: Authors' calculations. Source: Statistics Canada, Purchasing Power Parity Program. |
||||||
Conclusion
Several conclusions can be drawn from these price data. First, prices in the two countries generally do not equate. Relative prices do not remain constant when there are movements in the exchange rate. Substantial variability in relative Canadian prices, closely associated with changes in the market exchange rate, has been apparent in recent decades. When the Canadian dollar depreciated in the 1990s and early 2000s, the relative prices paid by Canadian consumers did not rise in proportion to the higher costs of imported products. By the late 1990s, the exchange‑rate‑adjusted prices paid for goods in Canada were near or below the median U.S. price levels. As the dollar then strengthened after 2002, relative price levels in Canada reversed course.
Second, the relative price of other consumer products (those not classified as alcohol and tobacco products or consumer food products affected by marketing boards or supply management) has been higher in Canada in recent years. The median after-tax CPL for these other consumer products was 17% above the U.S. price level in 2005, 24% higher in 2008 and 29% higher in 2011. Large increases in relative prices are most apparent for alcohol and tobacco products.
Third, sales taxes in general do not greatly affect the estimate of CPLs between the two countries from 2005 to 2011, except in the alcohol and tobacco consumer products group. In addition, changes in sales taxes do not affect changes in the final selling prices between Canada and the United States over this period.
Appendix 1: Product classification, 2005, 2008 and 2011
Goods — Consumer products — Alcohol and Tobacco
Spirits; wine; beer; and tobacco.
Goods — Consumer products — Foods affected by marketing boards or supply management
Poultry; fresh milk; preserved milk and other milk products; cheese; eggs and egg-based products; and butter.
Goods — Consumer products — Other
Rice; other cereals, flour and other cereal products; bread; other bakery products; pasta products; beef and veal; pork; lamb, mutton and goat; other meats and edible offal; delicatessen and other meat preparations; fresh, chilled or frozen fish and seafood; preserved or processed fish and seafood; margarine; other edible oils and fats; fresh or chilled fruit; frozen, preserved or processed fruit and fruit-based products; fresh or chilled vegetables other than potatoes; fresh or chilled potatoes; frozen, preserved or processed vegetables and vegetable-based products; sugar; jams, marmalades and honey; confectionery, chocolate and other cocoa preparations; edible ice, ice cream and sorbet; food products not elsewhere classified; coffee, tea and cocoa; mineral waters; soft drinks and concentrates; fruit and vegetable juices; clothing materials; men’s clothing; women’s clothing; children’s and infant’s clothing; other articles of clothing and clothing accessories; men’s footwear; women’s footwear; children’s and infant’s footwear; materials for the maintenance and repair of the dwelling; water supply; electricity; gas; liquid fuels; solid fuels; furniture and furnishings; carpets and other floor coverings; household textiles; major household appliances whether electric or not; small electric household appliances; glassware, tableware and household utensils; major tools and equipment; small tools and miscellaneous accessories; non-durable household goods; pharmaceutical products; other medical products; therapeutic appliances and equipment; motor cars; motor cycles; bicycles; spare parts and accessories for personal transport equipment; fuels and lubricants for personal transport equipment; telephone and telefax equipment; equipment for the reception, recording and reproduction of sound and pictures; photographic and cinematographic equipment and optical instruments; information processing equipment; pre-recorded recording media; unrecorded recording media; major durables for outdoor recreation; musical instruments and major durables for indoor recreation; games, toys and hobbies; equipment for sport, camping and open-air recreation; gardens, plants and flowers; pets and related products; books; newspapers and periodicals; miscellaneous printed matter, stationery and drawing materials; electric appliances for personal care; other appliances, articles and products for personal care; jewellery, clocks and watches; other personal effects.
Goods — Investment products
Fabricated metal products, except machinery and equipment; engines and turbines, pumps and compressors; other general purpose machinery; agricultural and forestry machinery; machine tools; machinery for metallurgy, mining, quarrying and construction; machinery for food, beverages and tobacco processing; machinery for textile, apparel and leather production; other special purpose machinery; office machinery; computers and other information processing equipment; electrical machinery and apparatus; radio, television and communications equipment and apparatus; medical, precision and optical instruments, watches and clocks; other manufactured goods not elsewhere classified; software; motor vehicles, trailers and semi-trailers; other road transport; ships, boats, steamers, tugs, floating platforms, rigs; locomotives and rolling stock; aircraft, helicopters, hovercraft and other aeronautical equipment; residential buildings; non-residential buildings; civil engineering works.
Services
Cleaning, repair and hire of clothing; repair and hire of footwear; actual rentals for housing; imputed rentals for housing; services for the maintenance and repair of the dwelling; miscellaneous services relating to the dwelling; repair of furniture, furnishings and floor coverings; repair of household appliances; domestic services; household services; medical services; dental services; paramedical services; hospital services; maintenance and repair of personal transport equipment; other services in respect of personal transport equipment; passenger transport by railway; passenger transport by road; passenger transport by air; passenger transport by sea and inland waterway; other purchased transport services; postal services; telephone and telefax services; repair of audio-visual, photographic and information processing equipment; maintenance and repair of other major durables for recreation and culture; veterinary and other services for pets; recreational and sporting services; photographic services; other cultural services; games of chance; holiday packages; education definable by level; education not definable by level; restaurant services whatever the type of establishment; pubs, bars, cafes, tea rooms and the like; canteens; accommodation services; hairdressing salons and personal grooming establishments; social protection; insurance; financial intermediation services indirectly measured; other financial services not elsewhere classified; other services.
Appendix 2: Price gap adjustments for sales tax differences
The starting point for comparing Canadian and U.S. prices is lists of prices that include indirect taxes. The estimates excluding taxes for both countries take into account only sales taxes. In other words, all taxes that are embedded in the price such as excise tax for cigarettes or fuel are still included.
The prices excluding sales tax for Canada are obtained from a database maintained by the Consumer Prices Division. This database updates every month all changes in indirect taxes that would affect a region or a good or service included in the Consumer Price Index.
In the United States, sales taxes are imposed at the state and local level. Consequently, there are different tax rates in the 50 states and often different surtax in different counties and cities of each state. Moreover, most of the states have tax rebates or tax exemptions on specific products such as groceries, prepared foods, clothing as well as prescribed and non-prescribed drugs. These tax rates were retrieved from the Internet,Note 12 and represent average tax rates for all states.
To derive a U.S. national sales tax, we have weighted the tax rates for each category mentioned above by a weight that combines the population share, the current GDP share and the employment share of each state.
References
For more information related to this Economic Insights article, see
Baldwin, J.R., and B. Yan. 2008. “Domestic and foreign influences on Canadian prices.” International Review of Economics and Finance 17 (4): 546–557.
Baldwin, J.R., and B. Yan. 2007. “Exchange rate cycles and Canada/U.S. manufacturing prices.” Review of World Economics (Weltwirtschaftliches Archiv) 143 (3): 508–533.
Baldwin, J.R., and B. Yan. 2004. “The law of one price: A Canada/U.S. exploration.” Review of Income and Wealth 50 (1): 1–10.
Gellatly, G., and B. Yan. 2012. “New Evidence on Exchange-rate Corrected Prices in Canada.” Economic Insights, no. 2. Statistics Canada Catalogue no. 11-626-XWE. Ottawa: Statistics Canada.
Porter, D. 2009. Loonie’s Leap: Mind the (Price) Gap. Special Report, BMO Capital Markets Economics.
Notes
- Date modified: