
Economic Insights
Labour Market Participation of Immigrant and Canadian-born Wives, 2006 to 2014

Archived Content
Information identified as archived is provided for reference, research or recordkeeping purposes. It is not subject to the Government of Canada Web Standards and has not been altered or updated since it was archived. Please "contact us" to request a format other than those available.
by René Morissette and Diane Galarneau
Social Analysis and Modelling Division and Labour Statistics Division
Start of text box
This Economic Insights article documents differences in labour market participation observed between immigrant wives and Canadian-born wives over the 2006-to-2014 period. It also assesses the degree to which the lower participation of immigrant wives, as compared with their Canadian-born counterparts, can be accounted for by differences in socioeconomic characteristics, such as family size, weekly wages of husbands, and labour force participation in the source country. The study uses the Labour Force Survey and World Bank indicators on source-country characteristics to examine these issues. Attention is restricted to Canadian-born women and landed immigrant women aged 25 to 54 who are married (or living in common-law relationships) with husbands aged 25 to 54 who are employed as paid workers.Note 1 For simplicity, the terms ‘husbands’ and ‘wives’ are used to refer to men and women who are married or in common-law relationships.
End of text box
Introduction
Over the past few decades, several Canadian studies have examined why immigrant men and women earn less than their Canadian-born counterparts. Differences in language skills, relatively low returns to foreign labour market experience, issues of credential recognition, perceived or actual differences in education quality, over-representation of recent immigrants in small firms or low-paying firms and discrimination have been cited as potential factors.Note 2 One reason these earnings differences have attracted considerable attention is that they have important implications for family income and, thus, for economic well-being.
In addition to differences in hourly wages, differences in the labour market participation of immigrant wives and Canadian-born wives may contribute to differences in family income. Indeed, lower rates of labour market participation among immigrant wives would result in lower family incomes, even in the absence of wage disparities. Yet, in spite of the importance of this issue, the labour market participation of immigrant women has been the subject of relatively little research. While some studies provide descriptive evidence showing that immigrant women have lower labour market participation rates than Canadian-born women (e.g., Preston and Giles 2004), none attempt to quantify the degree to which the difference between the two groups is explained by observed socioeconomic characteristics.
This article uses the Labour Force Survey (LFS) and World Bank indicators on source-country characteristics to fill this gap. It assesses the extent to which the lower labour force participation rate of immigrant wives, as compared with that of their Canadian-born counterparts, can be accounted for by socioeconomic factors, such as family size, weekly wages of husbands, and labour force participation in the source country.
Immigrant wives―especially the younger ones―participate less often in the labour market than Canadian-born wives
Of all immigrant wives aged 25 to 54 whose husbands were aged 25 to 54 and were employed as paid workers, 76% participated in the labour market―i.e., they had a job or actively looked for one―from 2010 to 2014 (Table 1). The labour force participation rate of Canadian-born wives was approximately 12 percentage points higher, at about 88%.
Regardless of their education level, the size of their family or their area of residence, immigrant wives have participation rates that are at least 6 percentage points lower than those of Canadian-born wives. This is true both for the 2006-to-2009 period and the 2010-to-2014 period.
While differences in labour force participation between immigrant women and Canadian-born women are prevalent, they vary in magnitude across age groups. The difference is largest for women aged 25 to 34, at approximately 20 percentage points. It is more modest for women aged 35 to 44, at 9 to 10 percentage points, and it is smallest for women aged 45 to 54, at about 4 percentage points.
The smaller difference observed for women aged 45 to 54 suggests that the labour market participation of immigrant wives might increase with time spent in Canada. The fact that immigrant wives who arrived in Canada within the last five years have lower participation rates than their counterparts who arrived at least six years ago is consistent with this view. However, the positive relationship between participation and years since arrival does not imply a causal link. Instead, it might reflect a cohort effect—that is, falling labour market participation rates across successive entry cohorts of immigrants.Note 3
Along with variation by age, the participation rates of immigrant wives vary by region of birth. Over the 2006-to-2009 period and the 2010-to-2014 period, female immigrants from Africa and Asia had, on average, lower participation rates than their counterparts from Latin America or Europe (Chart 1). Depending on the country of birth considered, the labour market participation rates of immigrant wives ranged from about 50% to 90% (Table 2).Note 4 Canadian-born wives were at the higher end of this distribution, at 87%. Overall, Tables 1 and 2 indicate that differences in labour market participation rates between immigrant and Canadian-born wives are widespread and generally substantial.

Description for Chart 1
The title of the graph is "Chart 1 Labour market participation rates of immigrant wives in the Canadian labour market, by region of birth, 2006 to 2009 and 2010 to 2014."
This is a column clustered chart.
There are in total 2 categories in the horizontal axis. The vertical axis starts at 0 and ends at 90 with ticks every 10 points.
There are 4 series in this graph.
The vertical axis is "percent."
The units of the horizontal axis are years from 2006 to 2009 and 2010 to 2014.
The title of series 1 is "Latin America."
The minimum value is 78.9 occurring in 2010 to 2014.
The maximum value is 80.3 occurring in 2006 to 2009.
The title of series 2 is "Europe."
The minimum value is 80.0 occurring in 2006 to 2009.
The maximum value is 83.6 occurring in 2010 to 2014.
The title of series 3 is "Africa."
The minimum value is 69.2 occurring in 2010 to 2014.
The maximum value is 72.1 occurring in 2006 to 2009.
The title of series 4 is "Asia."
The minimum value is 72.6 occurring in 2006 to 2009.
The maximum value is 74.3 occurring in 2010 to 2014.
| Time periods | Latin America | Europe | Africa | Asia |
|---|---|---|---|---|
| 2006 to 2009 | 80.3 | 80.0 | 72.1 | 72.6 |
| 2010 to 2014 | 78.9 | 83.6 | 69.2 | 74.3 |
About half of the difference in labour market participation between immigrant wives and Canadian-born wives can be accounted for by socioeconomic characteristics
Immigrant wives may have relatively low participation rates for a variety of reasons.
Their families, which average close to four persons, are larger than those of their Canadian-born counterparts (Table 3). Since family size is negatively correlated with labour force participation (Table 1), this may account for at least some the differences documented above.
Immigrant wives also generally come from countries where the involvement of women in the labour market, measured relative to that of men, is lower than it is in Canada. For instance, during the 2000s, female-to-male labour market participation ratios in Latin America, Africa and Asia were about 0.60—much lower than the ratio of 0.84 observed in Canada (Chart 2).Note 5 If, as Chart 3 shows, women from countries where labour market participation of women is low relative to that of men also participate less in the Canadian labour market (Frank and Hou 2015), then differences between immigrant and Canadian-born wives may reflect country-level effects.
Lower wage offers are potentially a third factor. Simple economic models predict that, all else being equal, lower wages make employment less attractive and, thus, tend to reduce labour force participation. When observationally equivalent women are compared, the hourly wages of immigrant wives are 20% lower than those of Canadian-born wives during the 2006-to-2014 period.Note 6 In other words, standardized real hourly wages of employed immigrant wives are lower than those of their Canadian-born counterparts. As Chart 4 shows, groups of wives―defined by country of birth―who earn relatively low standardized real hourly wages also display relatively low standardized labour market participation rates. This pattern is consistent with the view that lower wage offers might reduce the labour force participation of immigrant wives.Note 7
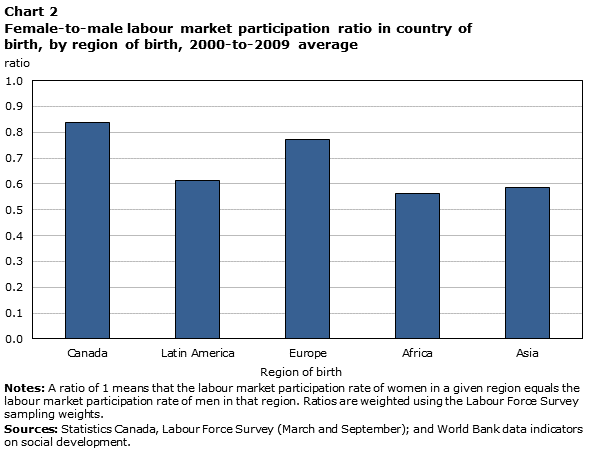
Description for Chart 2
The title of the graph is "Chart 2 Female-to-male labour market participation ratio in country of birth, by region of birth, 2000-to-2009 average."
This is a column clustered chart.
There are in total 5 categories in the horizontal axis. The vertical axis starts at 0 and ends at 1 with ticks every 0.1 points.
There are 1 series in this graph.
The vertical axis is "ratio."
The horizontal axis is "Region of birth."
The title of series 1 is "ratio."
The minimum value is 0.565 and it corresponds to "Africa."
The maximum value is 0.838 and it corresponds to "Canada."
| ratio | |
|---|---|
| Canada | 0.838 |
| Latin America | 0.612 |
| Europe | 0.772 |
| Africa | 0.565 |
| Asia | 0.588 |

Description for Chart 3
Labour market participation rates of wives in the Canadian labour market and female-to-male labour market participation ratios in source country, by country of birth.
The title of the graph is “Labour market participation rates of wives in the Canadian labour market and female-to-male labour market participation ratios in source country, by country of birth”
This is a scatter plot.
The vertical axis is “labour market participation rate (percent).”
The horizontal axis is “female-to-male labour market participation ratio.”
Description: Labour market participation rates are shown for Canadian-born and landed immigrant women aged 25 to 54, married (or living in common-law relationships) with husbands aged 25 to 54 who are employed as paid workers. They are averaged over the 2006-to-2014 period and shown for countries with at least 20 observations of wives employed as paid workers, i.e., for 85 countries (including Canada). Female-to-male labour market participation ratios are averaged over the 2000-to-2009 period. A female-to-male labour market participation ratio of 1 means that the labour market participation rate of women in a given country equals that of men. This chart shows that women from countries where labour market participation of women is low relative to that of men also participate less in the Canadian labour market.
The data sources for this chart are the Labour Force Survey (March and September) from Statistics Canada and the World Bank data indicators on social development.

Description for Chart 4
Standardized labour market participation rates of wives in the Canadian labour market and standardized real hourly wages earned in Canada by wives employed as paid workers, by country of birth, 2006 to 2014.
The title of the graph is “Standardized labour market participation rates of wives in the Canadian labour market and standardized real hourly wages earned in Canada by wives employed as paid workers, by country of birth, 2006 to 2014”
This is a scatter plot.
The vertical axis is “standardized labour market participation rate (percent).”
The horizontal axis is “standardized log real hourly wages (2014 dollars).”
Description: This chart plots the association between the standardized labour market participation rates and the standardized log real hourly wages of Canadian-born and landed immigrant women aged 25 to 54, married (or living in common-law relationships), with husbands aged 25 to 54 who are employed as paid workers. Numbers are shown for countries with at least 20 observations of wives employed as paid workers, i.e., for 85 countries (including Canada). Standardized labour market participation rates and real wages are obtained after controlling for all socioeconomic characteristics shown in Table 4 of the study. The table shows that groups of wives, defined by country of birth, who earn relatively low standardized real hourly wages also display relatively low standardized labour market participation rates.
The data sources for this chart are the Labour Force Survey (March and September) from Statistics Canada and the World Bank data indicators on social development.
Other factors are expected to be associated with higher participation rates among immigrant women. Their higher level of educational attainment relative to Canadian-born women is one of these. Another is the fact that the husbands of immigrant wives earn lower weekly wages than those of Canadian-born wives (Table 3). If lower husbands’ wages induce women to increase their labour supply (Devereux 2004; Morissette and Hou 2008), immigrant wives should, all else being equal, display higher participation rates than Canadian-born wives.
Of the five factors mentioned above―family size, country-level female-to-male labour market participation ratios, wives’ real hourly wages, wives’ education, and husbands’ wages―wives’ real hourly wages is the most difficult to assess. The reason is that while real hourly wages are observed for wives who are employed, they are not observed for non-employed wives. As a result, one needs to estimate the potential wage offers received by non-employed women, a statistically difficult task.Note 8 In contrast, the four other factors are observed for both employed and non-employed wives.
For this reason, the study first assesses the contribution of these four factors using multivariate analyses.Note 9 The results are shown in Table 4. During the 2006-to-2014 period, the labour market participation rate of immigrant wives was 11.4 percentage points lower than that of Canadian-born wives. Controlling for family size reduces this gap to 9.9 percentage points, thereby suggesting that the lower participation rate of immigrant wives is partly the result of their larger families. Controlling both for family size and country-level female-to-male labour market participation ratios reduces the participation difference between immigrant women and Canadian-born women to 4.8 percentage points. This suggests that country-level effects, as measured by female-to-male labour market participation ratios, account for a sizeable fraction of the 11.4-percentage-point difference. Adding further controls for the age and education of wives increases the adjusted difference in participation rates (from −4.8 percentage points to −5.8 percentage points). This is to be expected, since immigrant wives are more educated than Canadian-born wives, and labour market participation is positively correlated with education. Controlling for the weekly wages of husbands (along with family size, country-level female-to-male participation ratios, and wives’ age and education) also raises the adjusted difference in absolute value (from −5.8 percentage points to −6.5 percentage points), thereby confirming that the lower weekly earnings of immigrant husbands do not account for the relatively low participation rate of their wives.
After including additional controls for the number of other family members with employment, location of residence, the age and education of husbands, and indicators of husbands’ full-time employment and permanent job status, the difference in the labour force participation rates of immigrant and Canadian-born wives remains 5.3 percentage points. Hence, the socioeconomic characteristics shown in Table 4 account for about half of the 11.4-percentage-point difference in participation observed for the 2006-to-2014 period, with family size and country-level effects accounting for a significant fraction of the difference.Note 10,Note 11
Uncertainty about the contribution of wages
The next step is to examine whether, when all the characteristics discussed above (and shown in Table 4) are controlled for, the difference in labour force participation between immigrant wives and Canadian-born wives is further reduced when the wages of wives are taken into account.
As mentioned above, answering this question poses statistical challenges because wage offers are not observed for non-employed wives. Some non-employed wives of a given age, education level, family size and place of residence might be inactive because the costs of participating in the labour market are relatively high for them.Note 12 Others may be inactive because the wages they can potentially earn are relatively low. More precisely, some of these wives might potentially earn wages that are lower than the typical hourly wage―for example, the median hourly wage―received by their employed counterparts. The difficulty here is that while some non-employed wives might be offered wages that correspond to, say, the 40th percentile of the wage distribution of employed women in a given age, education, family size and place of residence category, others might potentially earn less or more than the 40th percentile, should they accept a job offer.
Chart 5 shows that the distinction matters empirically. Differences in labour market participation between immigrant wives and Canadian-born wives are computed after controlling for all the socioeconomic characteristics of Table 4, as well as for wives’ wages. Results are shown for various wage imputation strategies.Note 13 When wages of non-employed Canadian-born wives in a given group (defined by the interaction of three age categories, three education levels, four family-size categories and seven regions) are imputed based on the median hourly wage of their employed counterparts in that group and when wages of non-employed immigrant wives from a given country are imputed based on the median wage of their employed counterparts from that country, the adjusted participation difference remains unchanged at 5.3 percentage points.Note 14 When wages of non-employed wives are imputed based on the 40th percentile of the cells defined above, the adjusted difference drops from 5.3 percentage points to 3.2 percentage points. And, when wage imputation is based on the 30th percentile, the adjusted difference drops to about 1.0 percentage point. Hence, these numbers suggest that the lower wages received by immigrant wives might partly explain why immigrant wives are less active in the labour market than their Canadian-born counterparts. However, there is uncertainty regarding the exact contribution of wages to the difference in participation observed between the two groups of women.

Description for Chart 5
The title of the graph is "Chart 5 Adjusted difference in labour market participation rates between immigrant wives and Canadian-born wives, 2006 to 2014."
This is a bar clustered chart.
This is a horizontal bar graph, so categories are on the vertical axis and values on the horizontal axis.
There are in total 5 categories in the vertical axis. The horizontal axis starts at -6 and ends at 2 with ticks every 1 points.
There are 1 series in this graph.
The horizontal axis is "percentage points."
The vertical axis is "Wage imputation strategy."
The title of series 1 is "percentage points."
The minimum value is -5.3 and it corresponds to "No controls for wages and Wages imputed at the median."
The maximum value is 1.4 and it corresponds to "Wages imputed at the 20th percentile."
| percentage points | |
|---|---|
| No controls for wages | -5.3 |
| Wages imputed at the median | -5.3 |
| Wages imputed at the 40th percentile | -3.2 |
| Wages imputed at the 30th percentile | -0.9 |
| Wages imputed at the 20th percentile | 1.4 |
Unmarried immigrant and Canadian-born women have similar labour market participation rates
In the absence of a partner who can potentially contribute to the employment income of the family, immigrant women might participate in the labour market to a similar extent as Canadian-born women because of economic necessity. Table 5 investigates this by comparing the labour market participation rates of immigrant women and Canadian-born women aged 25 to 54 who are neither married nor living in common-law relationships. Overall, the large differences in labour market participation rates observed between immigrant and Canadian-born wives are not evident for unmarried women. About 83% of unmarried immigrant women participated in the labour market from 2010 to 2014, compared with 84% of unmarried Canadian-born women. Because unmarried immigrant women have higher levels of education than their Canadian-born counterparts, controlling for women’s education levels marginally increases the differences in labour market participation between the two groups from about 1.0 percentage point to between 2.0 percentage points and 2.6 percentage points, depending on whether the 2006-to-2009 period or the 2010-to-2014 period is considered.Note 15 The corresponding differences between immigrant and Canadian-born wives are substantially larger, at 11.5 percentage points to 12.3 percentage points. Hence, differences in labour market participation between immigrant women and Canadian-born women are very small for unmarried women and are substantially smaller for this group than they are for married women.
Summary
Immigrant wives participate in the Canadian labour market less than do Canadian-born wives. Because this lower participation has implications for the income and living standards of immigrant families, understanding the sources of the difference is important.
This study shows that differences in socioeconomic characteristics account for about half of the difference in labour market participation between immigrant wives and their Canadian-born counterparts observed for the 2006-to-2014 period. The results indicate that female-to-male labour market participation ratios in the source country and, to a lesser extent, family size are key drivers of the difference in participation observed between the two groups of women. The lower wages received by immigrant women in the Canadian labour market appear to play a role, but their contribution is difficult to quantify.
The results raise the question of which factors country-level female-to-male labour market participation ratios capture. Frank and Hou (2015) show that these ratios remain statistically significant in models of the labour market participation of immigrant women even after source-country gender-role attitudes are controlled for.Note 16 This finding suggests that these ratios capture, at least partly, other influences that affect the participation of immigrant women.
Overall, the study shows that a thorough understanding of differences in family income between immigrants and the Canadian-born requires an understanding not only of wage differences―as most Canadian studies have achieved so far―but also of differences in the labour market participation of wives.
References
Devereux, P.J. 2004. “Changes in relative wages and family labor supply.” Journal of Human Resources 39: 696–722.
Fortin, N.M. 2005. “Gender role attitudes and the labour-market outcomes of women across OECD countries.” Oxford Review of Economic Policy 21 (3): 416–438.
Frank, K., and F. Hou. 2015. Source-country Female Labour Force Participation and the Wages of Immigrant Women in Canada. Analytical Studies Branch Research Paper Series, no. 365. Statistics Canada Catalogue no. 11F0019M. Ottawa: Statistics Canada.
Morissette, R., and F. Hou. 2008. “Does the labour supply of wives respond to husbands’ wages? Canadian evidence from micro data and grouped data.” Canadian Journal of Economics 41 (4): 1185–1210.
Picot, G., and A. Sweetman. 2005. The Deteriorating Economic Welfare of Immigrants and Possible Causes: Update 2005. Analytical Studies Branch Research Paper Series, no. 262. Statistics Canada Catalogue no. 11F0019M. Ottawa: Statistics Canada.
Preston, V., and W. Giles. Employment Experiences of Highly Skilled Immigrant Women: Where Are They in the Labour Market? Paper presented at the Gender and Work: Knowledge Production in Practice conference, York University, October 1 and 2, 2004.
- Date modified: