
Economic Insights
Experimental Estimates of Cannabis Consumption in Canada, 1960 to 2015

Archived Content
Information identified as archived is provided for reference, research or recordkeeping purposes. It is not subject to the Government of Canada Web Standards and has not been altered or updated since it was archived. Please "contact us" to request a format other than those available.
by Ryan Macdonald and Michelle Rotermann
Economic Analysis Division and Health Analysis Division
Skip to text
Text begins
Start of text boxThis Economic Insights article presents experimental estimates of the number of tonnes of cannabis consumed by age group for the period from 1960 to 2015. The experimental estimates rely on survey data from multiple sources, statistical techniques to link the sources over time, and assumptions about consumption behaviour. They are subject to revision as improved or additional data sources become available.
Introduction
On April 13, 2017, the Government of Canada tabled legislation to legalize the recreational use of cannabis by adults. This will directly impact Canada’s statistical system. For example, once legalization occurs, cannabis activity will need to be incorporated into a broad range of economic and social statistics programs, including the Canadian System of Macroeconomic Accounts, consumer and producer prices, labour statistics, and international trade.Note In order to avoid creating distinct jumps in time series and to permit the examination of long-term trends, it is preferable to estimate the volume of cannabis consumption before legalization.
The focus of this Economic Insights article is to provide experimental estimates for the volume of cannabis consumption, based on existing information on the prevalence of cannabis use. Canada has been collecting information on the prevalence of cannabis use among the Canadian population through health, addiction and drug, tobacco or alcohol use monitoring surveys for over 50 years.Note
When linked over time using statistical techniques and combined with assumptions about consumption behaviour, these surveys provide a rich data source from which information about the volume of cannabis consumption consistent with the national accounts framework can be derived.Note
Estimation approach
The number of tonnes of cannabis consumed each year is estimated by means of an approach that first multiplies the population by the prevalence of cannabis use to estimate the number of consumers, and then multiplies the number of cannabis consumers by the number of days of consumption and their dosage per day. The calculations include assumptions to take bias and/or underreporting into account and are performed for specific age groups. This allows for changes in the age composition of cannabis consumers.
This estimation strategy follows that of the Parliamentary Budget Officer (PBO) (Office of the Parliamentary Budget Officer 2016), which forecasts consumption estimates for Canada in the period following legalization; of ESPAD (2015), which estimated cannabis consumption across a number of European nations; and of Abramsky and Drew (2014), who estimated cannabis consumption for inclusion in the national accounts of the United Kingdom.
What data are there on cannabis consumption prevalence?
Since the early 1970s, a series of national surveys have been conducted. Early periods have more sporadic data points, while numerous surveys are available for later periods. The national surveys with questions about cannabis, or marijuana, use begin with The Commission of Inquiry into the Non-Medical Use of Drugs (Le Dain 1972), commonly referred to as the “Le Dain Commission,” which was followed by the Health Promotion Survey (HPS) (Statistics Canada n.d.a, n.d.b); the National Alcohol and Drug Survey (NADS) (Statistics Canada n.d.c); the General Social Survey (GSS) (Statistics Canada n.d.d); Canada’s Alcohol and Other Drugs Survey (CADS) (Statistics Canada n.d.e); the Canadian Community Health Survey – Mental Health (Statistics Canada n.d.f, n.d.g); the Canadian Addiction Survey (CAS) (Adlaf, Begin and Sawka 2005); the Canadian Alcohol and Drug Use Monitoring Survey (CADUMS) (Health Canada n.d.); the Canadian Tobacco Use Monitoring Survey (CTUMS) (Statistics Canada n.d.h); and the Canadian Tobacco, Alcohol and Drugs Survey (CTADS) (Statistics Canada n.d.i, n.d.j).
These surveys have different questionnaires; purposes (e.g., drug, tobacco and alcohol use monitoring versus health surveys); collection modes (paper versus telephone or in-person interviews); and collection agencies and sponsors. Despite their differences, they tend to ask a similar question about cannabis use in the previous 12 months and have a similar target population.Note
Given the periodic implementation of early national surveys, it is difficult to create an annual time series for cannabis consumption without supplemental information. A number of regional surveys are available, and the estimates from surveys conducted by the Centre for Addiction and Mental Health (CAMH), including the Ontario Student Drug Use and Health Survey (OSDUHS) of high school students (Boak et al. 2015) and the CAMH Monitor (Ialomiteanu et al. 2016), which surveys adults, were included as part of the projector because they have the longest unbroken time span (1977 to 2015) and because they pertain to Ontario, the province with the highest population.
Published results from independent researchersNote are also used to quantify the increase in consumption in the late 1960s and early 1970s. The historical record shows a rapid spread of cannabis consumption among young people during this period. Most of these studies focus on high-school-aged persons; as a result, this age group accounts for most of the data for this period.
Turning survey data into a time series
In order to create a time series of prevalence from cross-sectional survey data, it is useful to decompose the problem into three steps: first, identify the most appropriate level; second, create the path through time; and third, benchmark it to the appropriate level. This approach ensures the strongest use of available data sources by permitting different types of surveys to play to their relative strengths.
The level for the prevalence of cannabis use is drawn from the 2002 and 2012 Canadian Community Health Survey – Mental Health (CCHS–MH). These surveys are believed to currently provide the most accurate prevalence estimate among existing self-reported survey data with respect to survey purpose and saliency (health survey compared to addiction or drug, tobacco or alcohol monitoring), mode (in-person interviews), collection, and survey weighting practices (see Rotermann and Macdonald forthcoming). From the 2002 and 2012 CCHS–MH, the prevalence for cannabis use is extracted for persons aged 15 to 17, 18 to 24, 25 to 44, and 45 to 64. These levels by age group form the base to which annual time series movements are benchmarked.
To estimate a time–path projector of cannabis consumption for each age group, prevalence estimates are compiled and collated from independent studies, the Le Dain Commission, the CAMH surveys, the CTUMS and the CTADS. An evaluation of competing data sources for the post-2000 period determined that CTUMS and CTADS are the preferred data sources for constructing annual time trends. These data sources cover many of the same reference periods as other data sources, but comprise a longer, unbroken series with more consistent terminology, survey methodologies, higher response rates and more precise survey weights (see Rotermann and Macdonald forthcoming; Macdonald and Rotermann forthcoming). Early national surveys (HPS, NADS, CADS, GSS) pertaining to the 1985-to-1994 period are also excluded because other more complete data series, namely, CAMH’s Monitor and OSDUHS, were available (see Macdonald and Rotermann forthcoming).
The estimates from independent studies, the Le Dain Commission, the estimates from the CAMH, the CTUMS and the CTADS cover a majority of the years from the late 1960s to 2015, but they do not cover all years, and not all data sources exactly correspond to the age categories from the 2002 and 2012 CCHS–MH benchmark(s).Note Linear interpolations are employed to bridge gaps between estimates when data are unavailable for a particular period, and the assumption that the CAMH data, the Le Dain Commission data, and data from independent surveys represent acceptable instrumental variables in the earlier period from which prevalence can be estimated (see Macdonald and Rotermann forthcoming).
Determining benchmarked and adjusted rates of cannabis consumption for Canada
Once the time–path projector is benchmarked to the CCHS–MH levels by age group, the number of cannabis consumers can be estimated by multiplying prevalence by population and making an adjustment for under reporting.Note Note Once this is done,
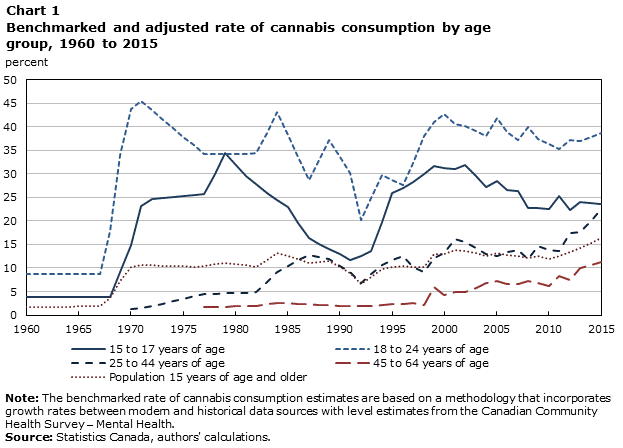
an image of how the rate of cannabis consumption adjusts through time emerges (Chart 1). Importantly, the level estimates for the benchmarked rate of cannabis consumption will generally not accord with published sources. Moreover, the quality of the instruments used to estimate the time path for this rate declines as one moves further into the past. Consequently, the path through time is not an exact measure for each age group in each year; rather, it shows broad changes across time periods with the highest quality estimates being those from 2002 onwards.
For the benchmarked and adjusted series, the results clearly show a rapid increase of cannabis consumption among youth in the late 1960s and early 1970s, from an assumed low level of consumption based on the earliest point the projector indicates.Note Rates for these age groups then stabilize before declining to a low point in the early 1990s. Through the rest of the 1990s, there is a return to a similar rate of cannabis consumption among youth as was observed in the 1970s, and, after the late 1990s and early 2000s, a second period of decline begins. The pattern is clearer for youth aged 15 to 17 than for those aged 18 to 24; this is likely related to data source availability. There are more data available, and at a higher frequency, for persons aged 15 to 17 than there are for older age categories.
Data table for Chart 1
| 15 to 17 years of age | 18 to 24 years of age | 25 to 44 years of age | 45 to 64 years of age | Population 15 years of age and older | |
|---|---|---|---|---|---|
| percent | |||||
| 1960 | 3.81 | 8.82 | Note ...: not applicable | Note ...: not applicable | 1.66 |
| 1961 | 3.81 | 8.82 | Note ...: not applicable | Note ...: not applicable | 1.67 |
| 1962 | 3.81 | 8.82 | Note ...: not applicable | Note ...: not applicable | 1.70 |
| 1963 | 3.81 | 8.82 | Note ...: not applicable | Note ...: not applicable | 1.74 |
| 1964 | 3.81 | 8.82 | Note ...: not applicable | Note ...: not applicable | 1.79 |
| 1965 | 3.81 | 8.82 | Note ...: not applicable | Note ...: not applicable | 1.84 |
| 1966 | 3.81 | 8.82 | Note ...: not applicable | Note ...: not applicable | 1.88 |
| 1967 | 3.81 | 8.82 | Note ...: not applicable | Note ...: not applicable | 1.93 |
| 1968 | 3.81 | 17.90 | Note ...: not applicable | Note ...: not applicable | 3.65 |
| 1969 | 9.24 | 34.03 | Note ...: not applicable | Note ...: not applicable | 7.25 |
| 1970 | 14.86 | 43.86 | 1.27 | Note ...: not applicable | 10.23 |
| 1971 | 23.15 | 45.38 | 1.41 | Note ...: not applicable | 10.72 |
| 1972 | 24.68 | 43.51 | 1.93 | Note ...: not applicable | 10.65 |
| 1973 | 24.90 | 41.64 | 2.45 | Note ...: not applicable | 10.52 |
| 1974 | 25.11 | 39.78 | 2.96 | Note ...: not applicable | 10.43 |
| 1975 | 25.32 | 37.91 | 3.48 | Note ...: not applicable | 10.32 |
| 1976 | 25.53 | 36.05 | 3.99 | Note ...: not applicable | 10.18 |
| 1977 | 25.75 | 34.18 | 4.51 | 1.75 | 10.45 |
| 1978 | 30.06 | 34.21 | 4.57 | 1.78 | 10.79 |
| 1979 | 34.37 | 34.24 | 4.63 | 1.81 | 11.09 |
| 1980 | 32.01 | 34.27 | 4.69 | 1.84 | 10.85 |
| 1981 | 29.64 | 34.30 | 4.75 | 1.87 | 10.59 |
| 1982 | 27.75 | 34.33 | 4.80 | 1.90 | 10.31 |
| 1983 | 25.86 | 38.72 | 7.02 | 2.27 | 11.74 |
| 1984 | 24.39 | 43.11 | 9.24 | 2.63 | 13.18 |
| 1985 | 22.91 | 38.32 | 10.44 | 2.51 | 12.52 |
| 1986 | 19.60 | 33.53 | 11.62 | 2.40 | 11.82 |
| 1987 | 16.30 | 28.74 | 12.75 | 2.28 | 11.16 |
| 1988 | 15.18 | 32.97 | 12.33 | 2.16 | 11.35 |
| 1989 | 14.05 | 37.21 | 11.92 | 2.05 | 11.53 |
| 1990 | 12.87 | 33.65 | 10.51 | 2.00 | 10.20 |
| 1991 | 11.69 | 30.10 | 9.11 | 1.95 | 8.92 |
| 1992 | 12.64 | 20.12 | 6.72 | 1.90 | 6.56 |
| 1993 | 13.58 | 24.88 | 8.71 | 2.02 | 8.01 |
| 1994 | 19.72 | 29.65 | 10.68 | 2.13 | 9.69 |
| 1995 | 25.86 | 28.66 | 11.62 | 2.25 | 10.22 |
| 1996 | 27.05 | 27.68 | 12.56 | 2.37 | 10.52 |
| 1997 | 28.23 | 32.37 | 10.19 | 2.49 | 10.12 |
| 1998 | 29.94 | 38.12 | 9.15 | 2.05 | 10.27 |
| 1999 | 31.65 | 40.99 | 12.14 | 5.99 | 12.97 |
| 2000 | 31.30 | 42.65 | 13.23 | 4.24 | 13.01 |
| 2001 | 30.94 | 40.54 | 16.17 | 4.82 | 13.92 |
| 2002 | 31.89 | 40.23 | 15.60 | 4.82 | 13.63 |
| 2003 | 29.56 | 39.11 | 14.25 | 5.78 | 13.09 |
| 2004 | 27.24 | 37.98 | 12.91 | 6.73 | 12.59 |
| 2005 | 28.52 | 41.83 | 12.48 | 7.33 | 13.08 |
| 2006 | 26.64 | 38.88 | 13.37 | 6.64 | 12.66 |
| 2007 | 26.40 | 37.20 | 13.84 | 6.51 | 12.50 |
| 2008 | 22.75 | 39.91 | 11.91 | 7.18 | 12.13 |
| 2009 | 22.72 | 37.33 | 14.67 | 6.81 | 12.56 |
| 2010 | 22.62 | 36.30 | 13.72 | 6.26 | 11.86 |
| 2011 | 25.25 | 35.36 | 13.71 | 8.32 | 12.51 |
| 2012 | 22.38 | 37.13 | 17.42 | 7.48 | 13.43 |
| 2013 | 23.96 | 36.90 | 17.63 | 9.94 | 14.29 |
| 2014 | 23.77 | 37.75 | 20.08 | 10.62 | 15.31 |
| 2015 | 23.59 | 38.59 | 22.52 | 11.31 | 16.29 |
|
... not applicable Note: The benchmarked cannabis consumption prevalence estimates are based on a methodology that incorporates growth rates between modern and historical data sources with level estimates from the Canadian Community Health Survey – Mental Health. Consequently, benchmarked prevalence estimates will not accord with the estimates published from data sources used to produce the time-series projector. This difference occurs between the benchmarked estimates and the estimates from the Canadian Tobacco, Alcohol and Drugs Survey and the Canadian Tobacco Use Monitoring Survey as well as those from the Centre for Addiction and Mental Health, independent studies or the Le Dain Commission. Source: Statistics Canada, authors' calculations. |
|||||
For persons aged 25 to 44, consumption begins at a low level in the early 1970s; from there, it increases along a linear trend through time.Note A similar increase occurs for persons aged 45 to 64. The increase among persons aged 25 to 44 is sufficiently large that, by 2015, they have roughly the same rate of consumption as persons aged 15 to 17.
With regard to the total rate of cannabis consumption, there is a rapid increase in the late 1960s and early 1970s resulting from the expansion of cannabis consumption among youth. Through the 1980s and early 1990s, declines among youth offset increases in consumption among older age groups. The 1990s have a larger increase in total consumption as both the younger age groups and the older age groups showed increases. Most recently, declines in use among youth have been outweighed by increases among older persons, which have led to an overall increase in cannabis consumption.
For all age groups, and for the total, there is a degree of time series variance in the estimates resulting from changes in data collection, sample sizes and/or interpolation that likely do not reflect actual changes in prevalence.Note This is particularly the case for consumption estimates for persons aged 18 to 24 from the 1960s to the end of the 1990s, and for persons aged 25 to 44 from the 1980s through the 1990s; care needs to be exercised in drawing conclusions about annual fluctuations during these years.
Composition of consumers
Data table for Chart 2
| 15 to 17 years of age | 18 to 24 years of age | 25 to 44 years of age | 45 to 64 years of age | |
|---|---|---|---|---|
| percent | ||||
| 1960 | 18.10 | 81.90 | Note ...: not applicable | Note ...: not applicable |
| 1961 | 18.58 | 81.42 | Note ...: not applicable | Note ...: not applicable |
| 1962 | 18.96 | 81.04 | Note ...: not applicable | Note ...: not applicable |
| 1963 | 19.16 | 80.84 | Note ...: not applicable | Note ...: not applicable |
| 1964 | 19.18 | 80.82 | Note ...: not applicable | Note ...: not applicable |
| 1965 | 19.04 | 80.96 | Note ...: not applicable | Note ...: not applicable |
| 1966 | 18.68 | 81.32 | Note ...: not applicable | Note ...: not applicable |
| 1967 | 18.19 | 81.81 | Note ...: not applicable | Note ...: not applicable |
| 1968 | 9.62 | 90.38 | Note ...: not applicable | Note ...: not applicable |
| 1969 | 11.72 | 88.28 | Note ...: not applicable | Note ...: not applicable |
| 1970 | 13.35 | 81.84 | 4.81 | Note ...: not applicable |
| 1971 | 18.64 | 76.62 | 4.73 | Note ...: not applicable |
| 1972 | 19.93 | 73.53 | 6.54 | Note ...: not applicable |
| 1973 | 20.09 | 71.50 | 8.41 | Note ...: not applicable |
| 1974 | 20.22 | 69.45 | 10.33 | Note ...: not applicable |
| 1975 | 20.46 | 67.24 | 12.30 | Note ...: not applicable |
| 1976 | 20.83 | 64.81 | 14.36 | Note ...: not applicable |
| 1977 | 20.12 | 59.74 | 15.90 | 4.24 |
| 1978 | 22.30 | 57.81 | 15.73 | 4.15 |
| 1979 | 24.15 | 56.14 | 15.65 | 4.06 |
| 1980 | 22.41 | 57.03 | 16.39 | 4.17 |
| 1981 | 20.13 | 58.37 | 17.20 | 4.31 |
| 1982 | 17.95 | 59.41 | 18.16 | 4.48 |
| 1983 | 13.62 | 57.98 | 23.71 | 4.69 |
| 1984 | 10.89 | 56.05 | 28.21 | 4.85 |
| 1985 | 10.56 | 50.54 | 34.04 | 4.85 |
| 1986 | 9.53 | 44.90 | 40.68 | 4.89 |
| 1987 | 8.18 | 38.95 | 47.95 | 4.92 |
| 1988 | 7.25 | 41.99 | 46.15 | 4.61 |
| 1989 | 6.36 | 44.93 | 44.41 | 4.30 |
| 1990 | 6.55 | 44.12 | 44.57 | 4.76 |
| 1991 | 6.79 | 43.67 | 44.16 | 5.37 |
| 1992 | 9.95 | 38.87 | 43.91 | 7.27 |
| 1993 | 8.66 | 38.70 | 46.21 | 6.44 |
| 1994 | 10.36 | 37.54 | 46.37 | 5.73 |
| 1995 | 12.94 | 33.82 | 47.41 | 5.83 |
| 1996 | 13.27 | 31.32 | 49.36 | 6.05 |
| 1997 | 14.35 | 37.77 | 41.16 | 6.72 |
| 1998 | 14.90 | 43.67 | 35.87 | 5.55 |
| 1999 | 12.41 | 37.32 | 37.11 | 13.16 |
| 2000 | 12.23 | 38.66 | 39.64 | 9.47 |
| 2001 | 11.19 | 34.24 | 44.35 | 10.21 |
| 2002 | 11.61 | 34.74 | 42.98 | 10.66 |
| 2003 | 11.00 | 35.26 | 40.16 | 13.59 |
| 2004 | 10.49 | 35.58 | 37.15 | 16.78 |
| 2005 | 10.74 | 37.40 | 33.95 | 17.92 |
| 2006 | 10.51 | 35.57 | 36.86 | 17.05 |
| 2007 | 10.45 | 34.33 | 38.02 | 17.20 |
| 2008 | 9.07 | 37.90 | 33.19 | 19.83 |
| 2009 | 8.55 | 34.18 | 38.91 | 18.35 |
| 2010 | 8.87 | 35.08 | 38.04 | 18.01 |
| 2011 | 9.24 | 32.30 | 35.73 | 22.73 |
| 2012 | 7.37 | 31.62 | 42.12 | 18.89 |
| 2013 | 7.12 | 29.52 | 39.93 | 23.43 |
| 2014 | 6.33 | 28.03 | 42.40 | 23.24 |
| 2015 | 5.77 | 26.44 | 44.64 | 23.15 |
|
... not applicable Note: Estimates for the population of cannabis consumers will differ from those in survey estimates due to (a) the use of benchmarked prevalence estimates; (b) the use of the Canadian population rather than the survey population; and (c) an assumed correction factor for underreporting. Source: Statistics Canada, authors' calculations. |
||||
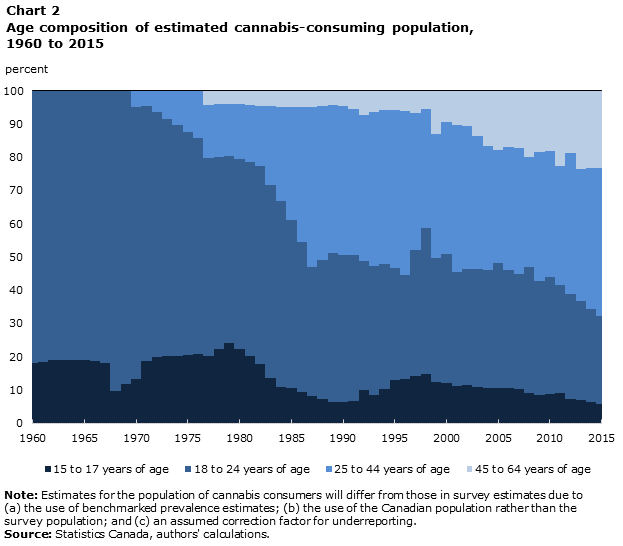
The results show that cannabis activity in the earliest years examined (1960 to 1980) is a youth market. However, in the middle of this period, the effect of rising consumption among persons aged 25 to 44 begins to transition the market towards older age groups (Chart 2). This process continues as persons aged 45 to 64 begin to enter the market in the late 1970s, and continues up to the last data point in 2015. In 2015, persons older than 24 account for two-thirds of cannabis consumers while persons aged 15 to 17 account for less than 6%.
The aging pattern is reflective of a demographic shift taking place over decades rather than the changes seen in consumption in the late 1960s and early 1970s that had more to do with a rapid shift of preferences within a cohort.Note The compositional change in the cannabis market is consistent with a change where the baby boomer cohort was exposed to cannabis in high school and university, and carried a preference for cannabis consumption with them as they aged.Note The rising trend occurs as boomers, and the cohorts that followed after them with similar exposure and preferences, replaced the war generation, which had different preferences with respect to cannabis use.
How are consumers transformed into tonnes consumed?
To estimate the volume of cannabis consumed from the number of consumers, two pieces of information are needed: (1) the number of consumption days, and (2) the quantity of cannabis consumed per day. However, there are important differences across age categories and in frequency of consumption.
As a result, to improve estimation, three additional steps are taken. First, measures of the number of consumption days are based on the frequency of cannabis consumption in the past year: daily; weekly but not daily; one to three times per month; less than once per month; and once. The conversion of consumption frequency to consumption days can lead to some uncertainty. In the absence of additional frequency information, the mid-point of each frequency bin is assumed to be the number of consumption days.Note
Second, the relative frequency of consumption for each age group of consumers is used to allocate consumers to reflect their frequency of consumption. The allocation reflects the result from the CCHS–MH 2012 that older consumers are more likely to be consistent consumers: the proportion of persons indicating that they consumed cannabis once per year falls as one moves to older age groups. Whether this reflects increased levels of experimentation on behalf of younger persons or a lack of occasion on behalf of older persons is not identifiable.
Third, for each frequency, the estimates for grams per day correspond to those from the PBO (Office of the Parliamentary Budget Officer 2016). Infrequent consumers are assigned small quantities of cannabis while more frequent consumers are assigned larger quantities. The estimates show low levels of consumption per day for low-frequency consumers and higher consumption volumes for higher-frequency consumers. The PBO adjusted U.S. estimates to match the Canadian frequency classification since there does not appear to be a Canadian data source. The same assumption is applied here, and the estimates from the Office of the Parliamentary Budget Officer are employed.
An estimated 700 tonnes consumed by 2015
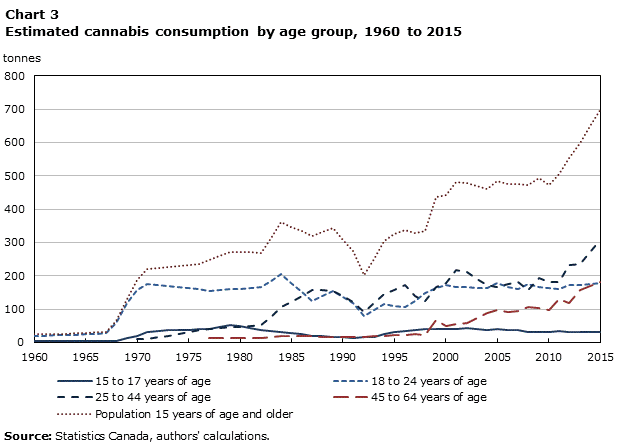
The estimate for the volume of cannabis consumed based on this methodology increases rapidly beginning in the late 1960s, and reaches 225 tonnes per year by 1973 (Chart 3). After that, the total volume of consumption rises more or less linearly, up to the 1980s, when volumes consumed begin to decline, reaching a low point in 1992. The remaining portion of the 1990s shows a period of increase, followed by a plateau over the 2000s and a rapid increase from 2010 to 2015.
The volume of cannabis consumed increases more rapidly than the cannabis-consuming population as a result of the evolution towards an older, more consistent cannabis- consuming population through time.
The relative importance of the different age groups, including the age groups with the highest rate of consumption or the highest number of current consumers, to the volume of cannabis consumption can change over time. Those aged 18 to 24 had the highest volume of consumption from the early part of the period until the middle of the 1980s. At that point, the consumption volume of those aged 25 to 44 attained roughly the same level, and eventually exceeded the consumption volumes of the younger cohort. By 2015, persons aged 45 to 64 were estimated to be consuming about the same quantity of cannabis as persons of university age.
For youth aged 15 to 17 and 18 to 24, there is little growth after the rapid increase noted in the late 1960s and early 1970s. What is observed is a dip, followed by a return to 1970s consumption levels for both age groups.
Data table for Chart 3
| 15 to 17 years of age | 18 to 24 years of age | 25 to 44 years of age | 45 to 64 years of age | Population 15 years of age and older | |
|---|---|---|---|---|---|
| tonnes | |||||
| 1960 | 3.51 | 20.64 | Note ...: not applicable | Note ...: not applicable | 24.15 |
| 1961 | 3.66 | 20.87 | Note ...: not applicable | Note ...: not applicable | 24.53 |
| 1962 | 3.88 | 21.57 | Note ...: not applicable | Note ...: not applicable | 25.45 |
| 1963 | 4.10 | 22.52 | Note ...: not applicable | Note ...: not applicable | 26.63 |
| 1964 | 4.33 | 23.72 | Note ...: not applicable | Note ...: not applicable | 28.05 |
| 1965 | 4.49 | 24.85 | Note ...: not applicable | Note ...: not applicable | 29.34 |
| 1966 | 4.64 | 26.25 | Note ...: not applicable | Note ...: not applicable | 30.89 |
| 1967 | 4.77 | 27.89 | Note ...: not applicable | Note ...: not applicable | 32.66 |
| 1968 | 4.90 | 59.83 | Note ...: not applicable | Note ...: not applicable | 64.73 |
| 1969 | 12.10 | 118.54 | Note ...: not applicable | Note ...: not applicable | 130.64 |
| 1970 | 19.93 | 158.91 | 9.52 | Note ...: not applicable | 188.37 |
| 1971 | 32.87 | 175.69 | 11.06 | Note ...: not applicable | 219.63 |
| 1972 | 35.78 | 171.69 | 15.57 | Note ...: not applicable | 223.04 |
| 1973 | 36.38 | 168.43 | 20.20 | Note ...: not applicable | 225.01 |
| 1974 | 37.20 | 166.18 | 25.19 | Note ...: not applicable | 228.56 |
| 1975 | 38.18 | 163.23 | 30.43 | Note ...: not applicable | 231.84 |
| 1976 | 39.39 | 159.37 | 36.01 | Note ...: not applicable | 234.77 |
| 1977 | 39.76 | 153.56 | 41.68 | 12.55 | 247.55 |
| 1978 | 46.38 | 156.36 | 43.38 | 12.92 | 259.04 |
| 1979 | 52.60 | 159.05 | 45.20 | 13.24 | 270.08 |
| 1980 | 48.89 | 161.84 | 47.41 | 13.62 | 271.76 |
| 1981 | 43.51 | 164.10 | 49.29 | 13.96 | 270.86 |
| 1982 | 38.38 | 165.23 | 51.49 | 14.34 | 269.45 |
| 1983 | 33.57 | 185.87 | 77.51 | 17.31 | 314.26 |
| 1984 | 30.58 | 204.70 | 105.04 | 20.40 | 360.72 |
| 1985 | 28.46 | 177.12 | 121.64 | 19.59 | 346.81 |
| 1986 | 24.57 | 150.57 | 139.07 | 18.86 | 333.08 |
| 1987 | 20.22 | 125.11 | 157.05 | 18.19 | 320.57 |
| 1988 | 18.52 | 139.48 | 156.30 | 17.63 | 331.93 |
| 1989 | 16.76 | 154.14 | 155.32 | 16.97 | 343.20 |
| 1990 | 15.51 | 135.91 | 139.96 | 16.90 | 308.28 |
| 1991 | 14.25 | 119.12 | 122.80 | 16.87 | 273.04 |
| 1992 | 15.56 | 79.05 | 91.05 | 17.02 | 202.69 |
| 1993 | 16.67 | 96.95 | 118.03 | 18.58 | 250.23 |
| 1994 | 24.44 | 115.20 | 145.11 | 20.26 | 305.01 |
| 1995 | 32.63 | 110.90 | 158.47 | 21.99 | 323.99 |
| 1996 | 34.92 | 107.25 | 172.31 | 23.87 | 338.35 |
| 1997 | 36.70 | 125.65 | 139.61 | 25.72 | 327.69 |
| 1998 | 39.15 | 149.20 | 124.93 | 21.84 | 335.12 |
| 1999 | 41.62 | 162.79 | 165.01 | 66.09 | 435.52 |
| 2000 | 41.81 | 171.93 | 179.72 | 48.48 | 441.94 |
| 2001 | 41.63 | 165.63 | 218.75 | 56.89 | 482.90 |
| 2002 | 42.89 | 166.93 | 210.56 | 58.97 | 479.36 |
| 2003 | 39.50 | 164.73 | 191.28 | 73.08 | 468.58 |
| 2004 | 36.80 | 162.35 | 172.86 | 88.18 | 460.19 |
| 2005 | 39.59 | 179.33 | 165.96 | 98.92 | 483.80 |
| 2006 | 38.04 | 167.44 | 176.89 | 92.40 | 474.77 |
| 2007 | 37.82 | 161.56 | 182.38 | 93.17 | 474.93 |
| 2008 | 32.35 | 175.79 | 156.93 | 105.91 | 470.98 |
| 2009 | 31.92 | 165.96 | 192.61 | 102.60 | 493.08 |
| 2010 | 31.70 | 163.04 | 180.22 | 96.35 | 471.31 |
| 2011 | 35.22 | 160.18 | 180.64 | 129.78 | 505.82 |
| 2012 | 30.68 | 171.15 | 232.44 | 117.77 | 552.04 |
| 2013 | 31.84 | 171.78 | 236.90 | 156.96 | 597.50 |
| 2014 | 30.71 | 176.74 | 272.60 | 168.75 | 648.81 |
| 2015 | 30.03 | 178.99 | 308.06 | 180.40 | 697.48 |
|
... not applicable Source: Statistics Canada, authors' calculations. |
|||||
The results suggest that, over time, not only is the overall cannabis-consuming population rising, but that those who are consuming cannabis tend, on average, to be older and consuming more per year than the average consumer did in the 1960s and 1970s.
Smoothing the number of tonnes consumed
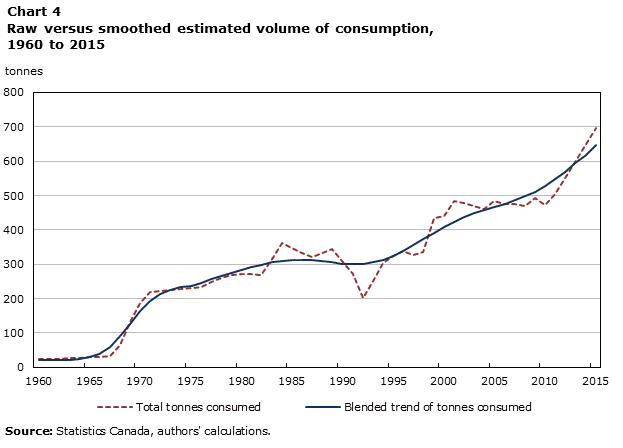
One of the challenges for interpreting the long-term trends in cannabis consumption is the year-to-year volatility that comes from the underlying data collection and compilation process, and from the existing gaps, which require linear interpolations to fill. It is therefore possible that annual changes reflect the data collection process, such as wide confidence intervals or intermittent survey collection, and do not stem from actual changes in cannabis consumption.
To produce a more interpretable series, it can be useful to smooth the unusual movements. A number of statistical tools are available to perform this type of filtering, and each has the goal of disentangling movements in trends from temporary movements through time. For the cannabis data presented below, a Hodrick–Prescott (HP) filter is applied in a piecewise manner. This is done to best capture the periods of rapid expansion and the period of slow rise afterwards, as different sets of smoothing parameters appear to best describe the two periods. To estimate the underlying trend change in the tonnes of cannabis consumed, an assumption of modest growth from 1960 to 1962 is combined with the two filtered series, which are joined in 1975/1976.
Data table for Chart 4
| Volume of consumption | ||
|---|---|---|
| Total tonnes consumed | Blended trend of tonnes consumed | |
| 1960 | 24.1 | 21.1 |
| 1961 | 24.5 | 21.4 |
| 1962 | 25.5 | 21.7 |
| 1963 | 26.6 | 21.9 |
| 1964 | 28.1 | 23.6 |
| 1965 | 29.3 | 28.7 |
| 1966 | 30.9 | 40.0 |
| 1967 | 32.7 | 60.0 |
| 1968 | 64.7 | 90.1 |
| 1969 | 130.6 | 127.0 |
| 1970 | 188.4 | 163.7 |
| 1971 | 219.6 | 193.5 |
| 1972 | 223.0 | 213.7 |
| 1973 | 225.0 | 225.9 |
| 1974 | 228.6 | 233.0 |
| 1975 | 231.8 | 237.9 |
| 1976 | 234.8 | 244.9 |
| 1977 | 247.6 | 255.8 |
| 1978 | 259.0 | 265.9 |
| 1979 | 270.1 | 275.2 |
| 1980 | 271.8 | 283.8 |
| 1981 | 270.9 | 291.9 |
| 1982 | 269.4 | 299.2 |
| 1983 | 314.3 | 305.5 |
| 1984 | 360.7 | 310.2 |
| 1985 | 346.8 | 312.7 |
| 1986 | 333.1 | 313.0 |
| 1987 | 320.6 | 311.6 |
| 1988 | 331.9 | 308.8 |
| 1989 | 343.2 | 305.3 |
| 1990 | 308.3 | 302.1 |
| 1991 | 273.0 | 300.2 |
| 1992 | 202.7 | 301.0 |
| 1993 | 250.2 | 305.5 |
| 1994 | 305.0 | 313.8 |
| 1995 | 324.0 | 325.3 |
| 1996 | 338.4 | 339.4 |
| 1997 | 327.7 | 355.6 |
| 1998 | 335.1 | 373.1 |
| 1999 | 435.5 | 391.1 |
| 2000 | 441.9 | 408.4 |
| 2001 | 482.9 | 424.0 |
| 2002 | 479.4 | 437.5 |
| 2003 | 468.6 | 448.9 |
| 2004 | 460.2 | 458.8 |
| 2005 | 483.8 | 467.8 |
| 2006 | 474.8 | 476.7 |
| 2007 | 474.9 | 486.3 |
| 2008 | 471.0 | 497.5 |
| 2009 | 493.1 | 511.1 |
| 2010 | 471.3 | 527.4 |
| 2011 | 505.8 | 546.9 |
| 2012 | 552.0 | 569.2 |
| 2013 | 597.5 | 593.7 |
| 2014 | 648.8 | 619.5 |
| 2015 | 697.5 | 645.9 |
| Source: Statistics Canada, authors' calculations. | ||
The smoothed series continues to show rapid growth in the late 1960s and early 1970s, after which it exhibits a more gradual upward movement, with a pause in the early 1990s, than does the raw series (Chart 4). This accords much more closely with the notion of a gradual, demographic-based change than the raw series would imply, and also helps deal with a number of methodological differences in the underlying surveys (Macdonald and Rotermann forthcoming).
How solid are these estimates?
Estimating the volume of cannabis consumption is fraught with methodological difficulties, missing information, differing quality instrumental variables and assumptions. Consequently, there is considerable uncertainty about the level of consumption. For some sources of uncertainty, such as the assumption that the relative frequency by age is fixed over time, there is no quantifiable measure of uncertainty. For other pieces of information, however, it is possible to examine confidence intervals or plausible ranges. In particular, the data from the 2012 CCHS–MH, which forms a base year and from which relative frequency information is drawn, provide a set of confidence intervals that can be used to assess uncertainty. Similarly, the upper and lower values for the number of consumer days, or the confidence intervals for consumption volumes per day, can be incorporated to indicate how much a particular change may influence the volume estimate.
The effect of sequentially adding these sources of uncertainty is shown in Chart 5. This chart shows the percentage change to the volume of cannabis consumption that comes from using the upper and lower values from either confidence intervals or plausible ranges. It begins by using the confidence interval for prevalence from the 2012 CCHS–MH, which is a benchmark year. Importantly, because the time series projector does not have a confidence interval, the measured uncertainty discussed here is equivalent to raising or lowering the volume estimate by a particular percentage along its entire length; this is how the uncertainty is shown.
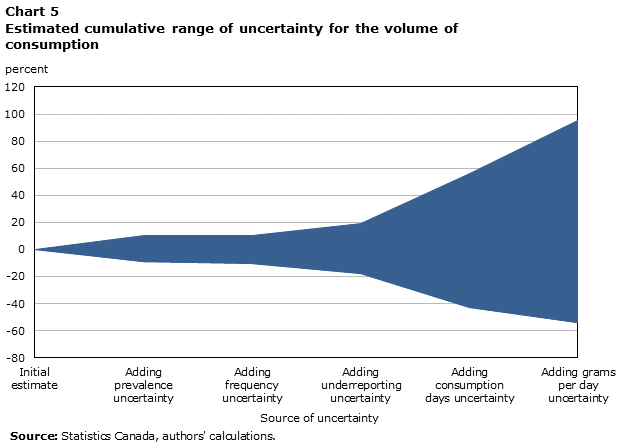
Data table for Chart 5
| Source of uncertainty | Lower bound | Upper bound |
|---|---|---|
| percent | ||
| Initial estimate | 0.00 | 0.00 |
| Adding prevalence uncertainty | -9.17 | 9.93 |
| Adding frequency uncertainty | -10.32 | 10.41 |
| Adding underreporting uncertainty | -17.62 | 19.23 |
| Adding consumption days uncertainty | -42.63 | 56.22 |
| Adding grams per day uncertainty | -54.11 | 95.40 |
| Source: Statistics Canada, authors' calculations. | ||
The effect of base year uncertainty for the prevalence estimates would lower the volume estimate by 9.2% or raise it by 9.9%. Including the uncertainty from the frequency distribution leads to a 1.2-percentage-point increase in the lower adjustment and a 0.5-percentage-point increase in the upper adjustment. The effect of uncertainty coming from the adjustment for survey underreporting leads to a 7.3-percentage-point change in the downward adjustment and an 8.8-percentage-point increase in the upper adjustment. This means that the number of cannabis consumers could be adjusted down by up to 17.6% or raised by up to 19.2%.
The uncertainty around the number of consumption days would lower the downward adjustment by 25.0 percentage points or raise it by 37.0 percentage points, while the uncertainty around grams consumed per day increases the lower bound by 11.5 percentage points and raises the upper bound by 39.2 percentage points. Cumulatively, the uncertainty about the volume estimate is sufficiently large that it could reasonably be reduced by about 54% or increased by about 95%.
Conclusion
An examination of the extended time series clearly reveals that many data sources indicate the same types of changes (i.e., rising prevalence, growing importance of older age groups and younger age groups that cycle), so the trends in consumption appear to be well-supported. However, early data sources do not align perfectly with later data sources. In particular, they tend to focus on urban areas or universities or can have smaller sample sizes. As well, societal acceptance of cannabis consumption changes over time and this can impact on people’s willingness to disclose this consumption activity. These changes have the potential to affect trends over time, are difficult to assess and are not controlled for.
Nevertheless, the extended time series matches the expectations one would have for cannabis activity: an initial focus on youth but aging through time; a rapid increase in the 1960s and early 1970s; an effect from the documented declines in youth consumption through the 1980s and early 1990s; the increases of the 1990s and thereafter.Note The broad trends also align well with other less-complete data sources, such as law enforcement records.Note Note
The levels for the population of cannabis consumers and the volume of consumption are subject to greater uncertainty. This occurs as there are unquantified degrees of uncertainty in the data. This does not make them invalid, but rather indicates that unresolved measurement challenges remain.
Nevertheless, the estimates for the cannabis-consuming population and the volume of consumption presented in this paper align with what is understood about Canadian cannabis activity overall. When the volume estimates are combined with the $7.14 per gram from Ouellet et al. (2017, p. 23), the $8.00 per gram from Tebrake (2017, “Non-medical cannabis: estimates of Canadian household expenditures,” fourth paragraph) or the $8.84 per gram from PBO (Office of the Parliamentary Budget Officer 2015, p. 2), the implied value of cannabis sales in Canada for the year 2015 would be $5.0 billion, $5.6 billion or $6.2 billion, respectively. This is would make the cannabis market in Canada in 2015 roughly one-half to two-thirds of the size of the $9.2 billion beer market or around 70% to 90% of the size of the $7.0 billion wine market. In other words, as a first effort to create a more complete numerical history for the illegal cannabis market in Canada, these estimates appear reasonable, and, although imperfect, they are the only long-term estimates currently available. It is hoped that refinements can be made to improve the estimates in the future—particularly as additional data sources become available—and that these estimates will not be viewed as the final say on what the cannabis market has looked like but, rather, that they will be considered an initial step to better data consistency, better information and better understanding.
References
Abramsky, J., and S. Drew. 2014. Changes to National Accounts: Inclusion of illegal drugs and prostitution in the UK National Accounts. Office for National Statistics. London, United Kingdom.
Adlaf, E.M., P. Begin, and E. Sawka, eds. 2005. Canadian Addiction Survey (CAS): A national survey of Canadians' use of alcohol and other drugs: Prevalence of use and related harms: Detailed report. Ottawa: Canadian Centre on Substance Abuse. Available at: http://www.ccsa.ca/Resource%20Library/ccsa-004028-2005.pdf (accessed November 9, 2017).
Boak, A., H.A. Hamilton, E.M. Adlaf, and R.E. Mann. 2015. Drug Use Among Ontario Students 1977-2015: Detailed OSDUHS findings. CAMH Research Document Series, no. 41. Toronto, Ontario: Centre for Addiction and Mental Health. Available at: https://www.camh.ca/en/research/news_and_publications/ontario-student-drug-use-and-health-survey/Documents/2015%20OSDUHS%20Documents/2015OSDUHS_Detailed_DrugUseReport.pdf (accessed November 9, 2017).
Currie, R.F., D. Perlman, and L. Walker. 1977. “Marijuana Use among Calgary Youths as a Function of Sampling and Locus of Control.” British Journal of Addiction 72: 159–165.
Desjardins, N., and T. Hotton. 2004. “Trends in Drug Offenses and the Role of Alcohol and Drugs in Crime.” Juristat 24 (1): 1–23. Statistics Canada Catalogue no. 85-002-XPE. Ottawa: Statistics Canada.
ESPAD (European School Survey Project on Alcohol and Other Drugs). 2015. The 2015 ESPAD Report: Results from the European School Survey Project on Alcohol and Other Drugs. Available at http://www.espad.org/report/home (accessed November 27, 2017).
Green, M., and R.D. Miller. 1975. “Cannabis Use in Canada.” In Cannabis and Culture, ed. V. Rubin, Part Five: The Modern Complex in North America, p. 497‑520. The Hague: Moulton Publishers.
Health Canada. n.d. Canadian Alcohol and Drug Use Monitoring Survey(CADUMS). Available at: https://www.canada.ca/en/health-canada/services/health-concerns/drug-prevention-treatment/canadian-alcohol-drug-use-monitoring-survey.html (accessed November 9, 2017). Reports from 2008 to 2012.
Ialomiteanu, A.R., H.A. Hamilton, E.M. Adlaf, and R.E. Mann. 2016. CAMH Monitor eReport 2015: Substance Use, Mental Health and Well-Being Among Ontario Adults, 1977-2015. CAMH Research Document Series, no. 45. Toronto, Ontario: Centre for Addiction and Mental Health. Available at: https://www.camh.ca/en/research/news_and_publications/CAMH%20Monitor/CAMH-Monitor-2015-eReport-Final-Web.pdf (accessed November 9, 2017).
Ialomiteanu, A., E. Adlaf, H. Hamilton, and R. Mann. 2012. CAMH Monitor eReport: Addiction and Mental Health Indicators Among Ontario Adults, 1977-2011. CAMH Research Document Series, no. 35. Toronto: Centre for Addiction and Mental Health. Available at: http://www.camh.ca/en/research/news_and_publications/CAMH%20Monitor/CAMH-Monitor-2011-Trends-eReport-Final.pdf (accessed November 29, 2017).
Kostadinov, V., and A. Roche. 2017. “Bongs and baby boomers: Trends in cannabis use among older Australians.” Australasian Journal of Ageing 36 (1): 59–69.
Lanphier, C.M., and S.B. Phillips, I. 1971. Unpublished Commission research project. Commission of Inquiry into the Non-medical Use of Drugs. Ottawa. (Published in part in the Commission’s Cannabis Report and Final Report. As reported in Green and Miller [1975].)
Le Dain, G. (chairman). 1972. Cannabis: A Report of the Commission of Inquiry into the Non-medical Use of Drugs. Ottawa: Information Canada.
Macdonald, R., and M. Rotermann. Forthcoming. Constructing Historical Cannabis Consumption Volume Estimates for Canada: 1960 to 2015. Ottawa: Statistics Canada.
Mawani, F., A. Maslov, and A. Lawrence. 2017. Measuring Illicit Cannabis Seizures in Canada: Methods, Practices and Recommendations. Research Report 2017-R002. Ottawa, Ontario: Public Safety Canada. Available at: https://www.publicsafety.gc.ca/cnt/rsrcs/pblctns/2017-r002/2017-r002-en.pdf (accessed November 27, 2017).
NIDA (National Institute on Drug Abuse). 2015. Publications - Drug Facts. Department of Health and Human Services USA. Available at: http://www.drugabuse.gov/publications/finder/t/160/drugfacts (accessed November 9, 2017).
Office of the Parliamentary Budget Officer. 2016. Legalized Cannabis: Fiscal Considerations. Ottawa. Available at: http://www.pbo-dpb.gc.ca/web/default/files/Documents/Reports/2016/Legalized%20Cannabis%20Fiscal%20Considerations_EN.pdf (accessed November 27, 2017).
Ouellet, M., M. Macdonald, M. Bouchard, C. Morselli, and R. Frank. 2017. The price of cannabis in Canada. Research Report 2017-R005. Ottawa: Public Safety Canada. Available at: https://www.publicsafety.gc.ca/cnt/rsrcs/pblctns/2017-r005/2017-r005-en.pdf (accessed November 27, 2017).
Rootman, I. 1972. “Drug use among rural students in Alberta.” Canada’s Mental Health 20: 9–14. As reported in Green and Miller (1975).
Rotermann, M., and R. Macdonald. Forthcoming. Trends in Marijuana use in Canada, 1985 to 2015. Ottawa: Statistics Canada.
Smart, R.G., and D. Fejer. 1971. Marijuana use among adults in Toronto. Project j-183, Substudy 6-7 and Jo-71. Toronto: Addiction Research Foundation. Unpublished manuscript. As reported in Green and Miller (1975).
Smart, R.G., D. Fejer, and J. White. 1972. Drug use among metropolitan Toronto students. Toronto: Addiction Research Foundation. Unpublished manuscript. As reported in Green and Miller (1975).
Statistics Canada n.d.a. Health Promotion Survey, Detailed information for 1985. Last updated October 24, 2007. Available at: http://www23.statcan.gc.ca/imdb/p2SV.pl?Function=getSurvey&Id=3427 (accessed November 9, 2017).
Statistics Canada. n.d.b. Health Promotion Survey, Detailed information for 1990. Last updated October 24, 2007. Available at: http://www23.statcan.gc.ca/imdb/p2SV.pl?Function=getSurvey&Id=6093 (accessed November 27, 2017).
Statistics Canada. n.d.c. 1989. National Alcohol and Drug Survey, Detailed information for 1989. Available at: http://www23.statcan.gc.ca/imdb/p2SV.pl?Function=getSurvey&SDDS=3873 (accessed November 9, 2017).
Statistics Canada. n.d.d. General Social Survey – Personal Risk (GSS), Detailed information for 1993 (Cycle 8). Last updated October 24, 2007. Available at: http://www23.statcan.gc.ca/imdb/p2SV.pl?Function=getSurvey&Id=5266 (accessed November 9, 2017).
Statistics Canada. n.d.e. Canada’s Alcohol and Other Drugs Survey, Detailed information for 1994. Last updated October 24, 2007. Available at: http://www23.statcan.gc.ca/imdb/p2SV.pl?Function=getSurvey&Id=3482 (accessed November 9, 2017).
Statistics Canada. n.d.f. Canadian Community Health Survey – Mental Health (CCHS), Detailed information for 2012. Last updated September 10, 2013. Available at: http://www23.statcan.gc.ca/imdb/p2SV.pl?Function=getSurvey&Id=119789 (accessed November 9, 2017).
Statistics Canada. n.d.g. Canadian Community Health Survey – Mental Health (CCHS) and Well-being, Detailed information for 2002 (Cycle 1.2). Last updated October 24, 2007. Available at: http://www23.statcan.gc.ca/imdb/p2SV.pl?Function=getSurvey&Id=5285 (accessed November 27, 2017).
Statistics Canada. n.d.h. Canadian Tobacco Use Monitoring Survey (CTUMS), Other reference periods. Last modified January 27, 2017. Available at: http://www23.statcan.gc.ca/imdb/p2SV.pl?Function=getInstanceList&Id=21979 (accessed November 9, 2017). CTUMS reference periods from 2004 to 2012.
Statistics Canada. n.d.i. Canadian Tobacco, Alcohol and Drugs Survey (CTADS), Detailed information for February to December 2013. Last updated January 31, 2013. Available at: http://www23.statcan.gc.ca/imdb/p2SV.pl?Function=getSurvey&Id=136981 (accessed November 9, 2017).
Statistics Canada. n.d.j. Canadian Tobacco, Alcohol and Drugs Survey (CTADS), Detailed information for 2015. Last modified November 8, 2016. Available at: http://www23.statcan.gc.ca/imdb/p2SV.pl?Function=getSurvey&Id=299299 (accessed November 29, 2017).
Statistics Canada. 2017. Preparing the statistical system for the legalization of cannabis. Latest Developments in the Canadian System of National Accounts. Statistics Canada Catalogue no. 13‑605-X. Ottawa, Ontario. Available at: http://www.statcan.gc.ca/pub/13-605-x/2017001/article/14840-eng.htm (accessed November 29, 2017).
Tebrake, J. 2017. A cannabis economic account – The framework. Latest Developments in the Canadian Economic Accounts. Statistics Canada Catalogue no. 13-605-X. Ottawa, Ontario. Available at http://www.statcan.gc.ca/pub/13-605-x/2017001/article/54881-eng.htm (accessed November 22, 2017).
United Nations, European Commission, International Monetary Fund, Organisation for Economic Co-operation and Development, and World Bank. 2009. System of National Accounts, 2008. New York: United Nations. Available at: https://unstats.un.org/unsd/nationalaccount/docs/sna2008.pdf (accessed November 28, 2017).
United Nations Office on Drugs and Crime. 2007. 2007 World Drug Report. Vienna, Austria: Vienna International Centre. Available at: https://www.unodc.org/pdf/research/wdr07/WDR_2007.pdf (accessed November 9, 2017).
- Date modified: