
Infographic: The Journey of Statistics Canada Data

Archived Content
Information identified as archived is provided for reference, research or recordkeeping purposes. It is not subject to the Government of Canada Web Standards and has not been altered or updated since it was archived. Please "contact us" to request a format other than those available.
Description for Infographic: The Journey of Statistics Canada Data
Source: Statistics Canada
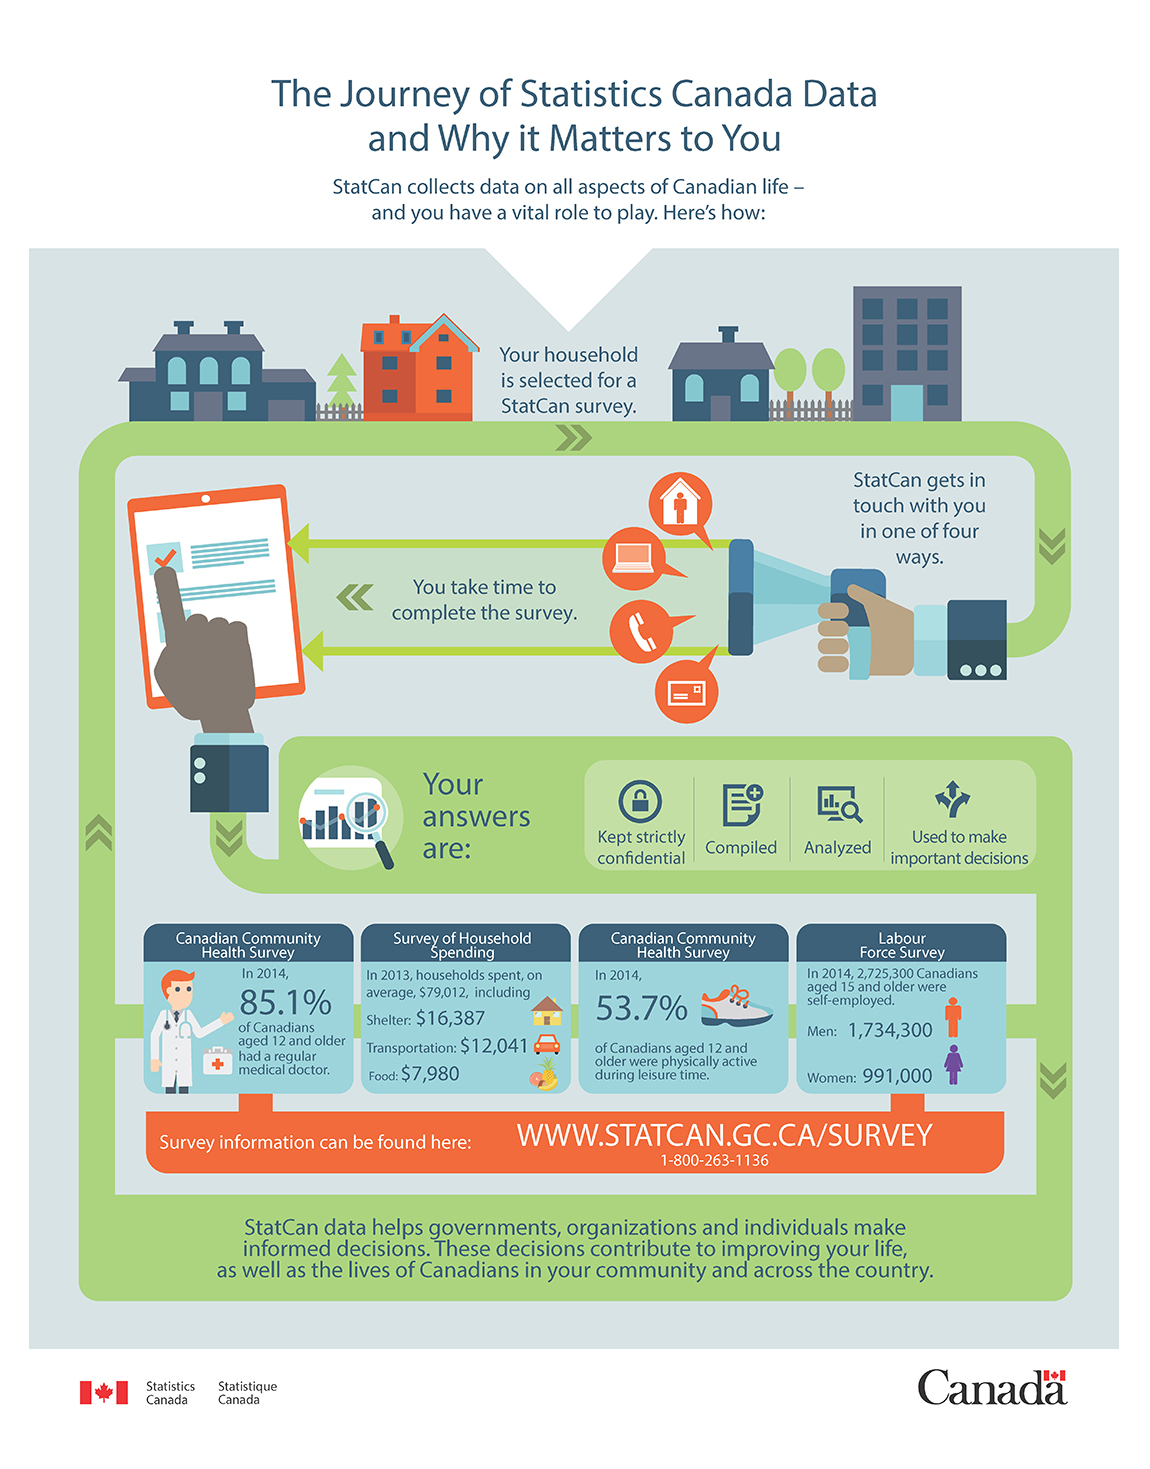
The Journey of Statistics Canada data and why it matters to you
StatCan collects data on all aspects of Canadian life, and you have a vital role to play. Here's how:
- Your household is selected for a StatCan survey.
- StatCan gets in touch with you in one of four ways:
- by a visit from an interviewer;
- by email;
- by phone; or
- by mail.
- You take time to complete the survey.
- Your answers are:
- kept strictly confidential;
- compiled;
- analysed;
- then used to make important decisions.
Samples from Statistics Canada data:
Canadian Community Health Survey
- In 2014, 85.1% of Canadians aged 12 and older had a regular medical doctor.
Survey of Household Spending
- In 2013, households spend, on average, $79,012, including $16,387 on shelter, $12,041 on transportation and $7,980 on food.
Canadian Community Health Survey
- In 2014, 53.7% of Canadians aged 12 and older were physically active during leisure time.
Labour Force Survey
- In 2014, 2,725,300 Canadians aged 15 and older were self-employed, including 1,734,300 men and 991,000 women.
Survey information can be found here or by calling 1-800-263-1136.
StatCan data helps governments, organizations and individuals make informed decisions. These decisions contribute to improving your life, as well as the lives of Canadians in your community and across the country.
- Date modified: