
Mortality trends in Canada, 2013

Archived Content
Information identified as archived is provided for reference, research or recordkeeping purposes. It is not subject to the Government of Canada Web Standards and has not been altered or updated since it was archived. Please "contact us" to request a format other than those available.
Description: Mortality trends in Canada, 2013
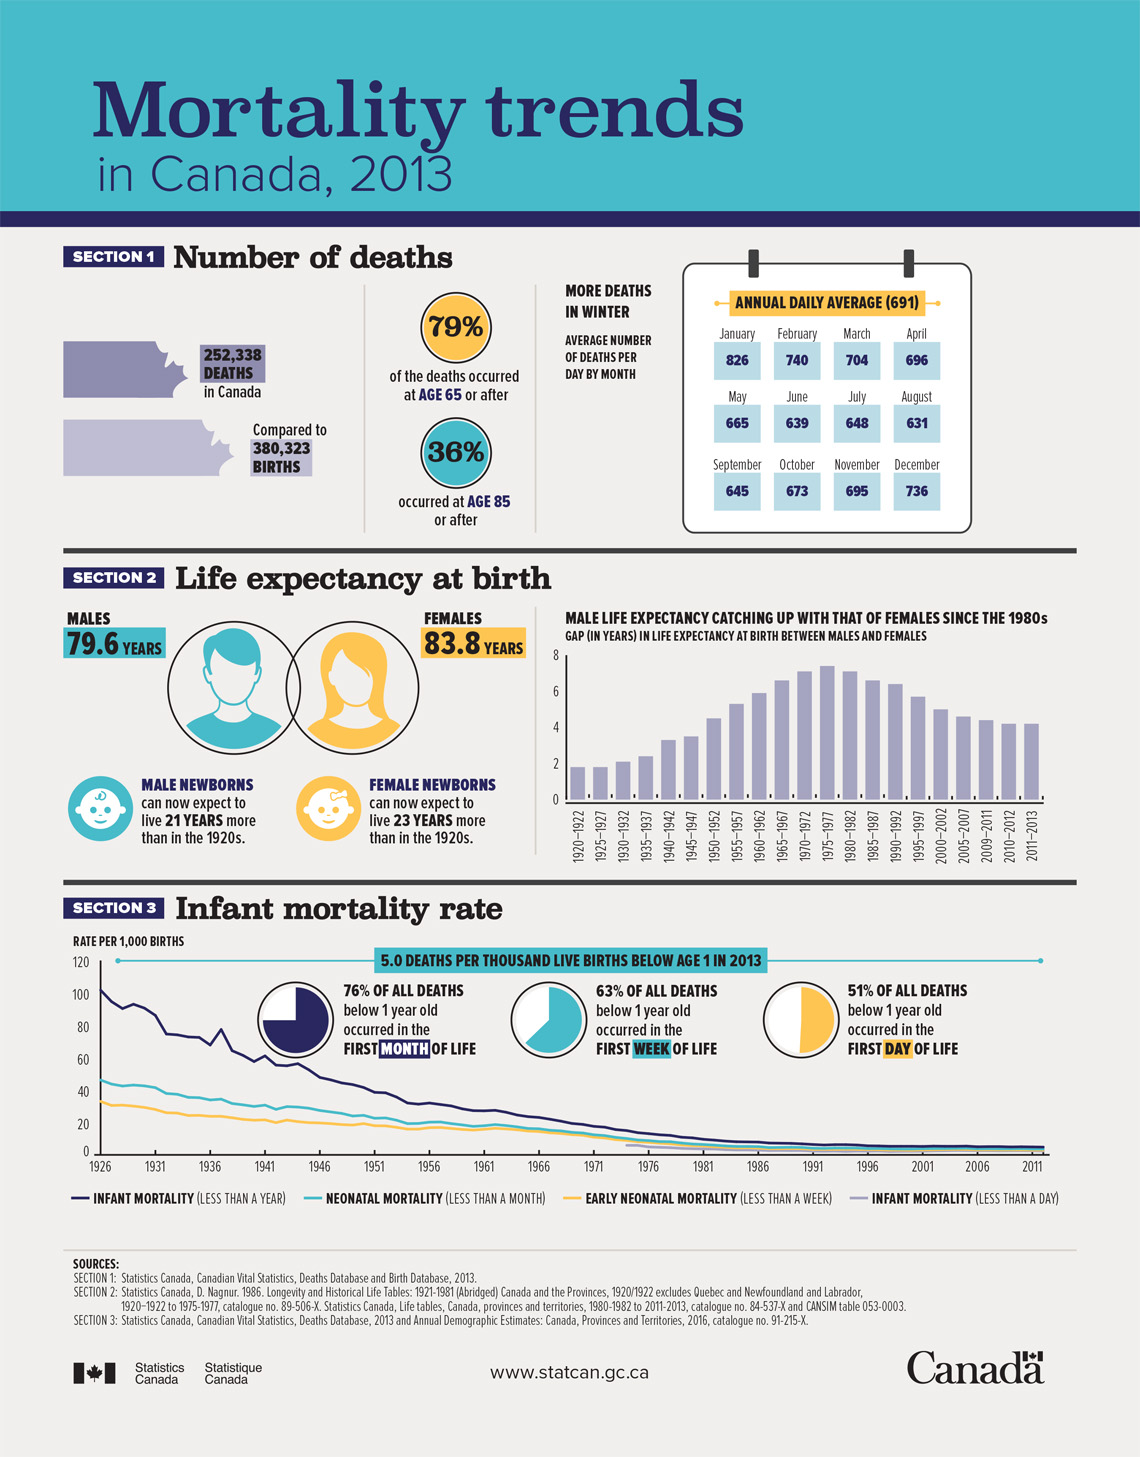
Section 1 – Number of deaths
- 252,338 deaths in Canada
- Compared to 380,323 births
- 79% of the deaths occurred at age 65 or after
- 36% occurred at age 85 or after
More deaths in winter
| Month | Deaths |
|---|---|
| January | 826 |
| February | 740 |
| March | 704 |
| April | 696 |
| May | 665 |
| June | 639 |
| July | 648 |
| August | 631 |
| September | 645 |
| October | 673 |
| November | 695 |
| December | 736 |
| Annual daily average (691) | |
Section 2 – Life expectancy at birth
- Males: 79.6 years
- Females: 83.8 years
- Male newborns can now expect to live 21 years more than in 1920s.
- Female newborns can now expect to live 23 years more than in 1920s.
Male life expectancy catching up with that of females since the 1980s.
| Years | Gap in years |
|---|---|
| 1920-1922 | 1.8 |
| 1925-1927 | 1.8 |
| 1930-1932 | 2.1 |
| 1935-1937 | 2.5 |
| 1940-1942 | 3.2 |
| 1945-1947 | 3.4 |
| 1950-1952 | 4.6 |
| 1955-1957 | 5.2 |
| 1960-1962 | 5.8 |
| 1965-1967 | 6.7 |
| 1970-1972 | 7.0 |
| 1975-1977 | 7.3 |
| 1980-1982 | 7.0 |
| 1985-1987 | 6.7 |
| 1990-1992 | 6.5 |
| 1995-1997 | 5.5 |
| 2000-2002 | 5.0 |
| 2005-2007 | 4.7 |
| 2009-2011 | 4.5 |
| 2010-2012 | 4.2 |
| 2011-2013 | 4.2 |
Section 3 – Infant mortality rate
- 5.0 deaths per thousand live birth below age 1 in 2013
- 76% of all deaths below 1 year old occurred in the first month of life
- 63% of all deaths below 1 year old occurred in the first week of life
- 51% of all deaths below 1 year old occurred in the first day of life
| Year | Infant mortality | Neonatal Mortality (less than a month) |
Early neonatal mortality (less than a week) |
Infant mortality (less than a day) |
|---|---|---|---|---|
| 1921 | 102.2 | 27.2 | 19.0 | n/a |
| 1922 | 101.7 | 27.7 | 19.6 | n/a |
| 1923 | 103.4 | 28.2 | 19.6 | n/a |
| 1924 | 94.0 | 26.1 | 18.6 | n/a |
| 1925 | 92.8 | 25.2 | 18.1 | n/a |
| 1926 | 101.7 | 46.2 | 33.0 | n/a |
| 1927 | 94.6 | 43.7 | 30.5 | n/a |
| 1928 | 90.3 | 42.5 | 30.7 | n/a |
| 1929 | 93.0 | 43.1 | 30.1 | n/a |
| 1930 | 90.6 | 42.6 | 29.3 | n/a |
| 1931 | 86.1 | 41.5 | 28.0 | n/a |
| 1932 | 74.6 | 37.9 | 26.0 | n/a |
| 1933 | 74.1 | 37.4 | 25.8 | n/a |
| 1934 | 72.8 | 35.5 | 24.3 | n/a |
| 1935 | 72.5 | 35.3 | 24.4 | n/a |
| 1936 | 67.8 | 33.9 | 23.8 | n/a |
| 1937 | 77.4 | 34.4 | 23.8 | n/a |
| 1938 | 64.3 | 31.7 | 22.9 | n/a |
| 1939 | 61.4 | 30.9 | 21.9 | n/a |
| 1940 | 57.6 | 29.9 | 21.4 | n/a |
| 1941 | 61.1 | 30.7 | 21.6 | n/a |
| 1942 | 55.4 | 28.1 | 19.9 | n/a |
| 1943 | 55.0 | 29.8 | 21.5 | n/a |
| 1944 | 56.3 | 29.5 | 20.5 | n/a |
| 1945 | 52.5 | 28.8 | 19.9 | n/a |
| 1946 | 47.8 | 27.4 | 19.7 | n/a |
| 1947 | 46.3 | 26.5 | 19.3 | n/a |
| 1948 | 44.4 | 25.6 | 18.7 | n/a |
| 1949 | 43.4 | 24.0 | 18.4 | n/a |
| 1950 | 41.6 | 24.4 | 19.3 | n/a |
| 1951 | 38.6 | 22.6 | 18.0 | n/a |
| 1952 | 38.3 | 22.8 | 17.9 | n/a |
| 1953 | 35.7 | 21.4 | 17.0 | n/a |
| 1954 | 32.0 | 19.3 | 15.9 | n/a |
| 1955 | 31.3 | 19.4 | 15.9 | n/a |
| 1956 | 32.0 | 20.2 | 16.8 | n/a |
| 1957 | 31.1 | 20.3 | 16.9 | n/a |
| 1958 | 30.2 | 19.3 | 16.3 | n/a |
| 1959 | 28.4 | 18.5 | 15.7 | n/a |
| 1960 | 27.3 | 17.6 | 15.3 | n/a |
| 1961 | 27.2 | 18.0 | 15.8 | n/a |
| 1962 | 27.5 | 18.7 | 16.4 | n/a |
| 1963 | 26.3 | 18.1 | 16.0 | n/a |
| 1964 | 24.6 | 17.3 | 15.5 | n/a |
| 1965 | 23.6 | 16.3 | 14.7 | n/a |
| 1966 | 23.1 | 16.1 | 14.4 | n/a |
| 1967 | 22.0 | 15.2 | 13.6 | n/a |
| 1968 | 20.8 | 14.8 | 13.2 | n/a |
| 1969 | 19.4 | 13.9 | 12.5 | n/a |
| 1970 | 18.8 | 13.5 | 12.1 | n/a |
| 1971 | 17.6 | 12.4 | 10.9 | n/a |
| 1972 | 17.1 | 11.9 | 10.4 | n/a |
| 1973 | 15.6 | 10.8 | 9.4 | n/a |
| 1974 | 15.0 | 10.1 | 8.9 | 5.9 |
| 1975 | 13.7 | 9.2 | 8.1 | 5.9 |
| 1976 | 13.1 | 8.8 | 7.7 | 4.9 |
| 1977 | 12.4 | 8.2 | 7.2 | 4.7 |
| 1978 | 12.0 | 8.1 | 6.8 | 4.4 |
| 1979 | 10.9 | 7.3 | 6.1 | 4.0 |
| 1980 | 10.5 | 6.7 | 5.7 | 3.8 |
| 1981 | 9.6 | 6.4 | 5.5 | 3.7 |
| 1982 | 9.1 | 6.0 | 5.0 | 3.6 |
| 1983 | 8.5 | 5.5 | 4.7 | 3.2 |
| 1984 | 8.1 | 5.2 | 4.3 | 3.0 |
| 1985 | 8.0 | 5.2 | 4.4 | 3.0 |
| 1986 | 7.9 | 5.1 | 4.2 | 2.9 |
| 1987 | 7.3 | 4.5 | 3.8 | 2.7 |
| 1988 | 7.2 | 4.6 | 3.8 | 2.7 |
| 1989 | 7.1 | 4.7 | 3.9 | 2.7 |
| 1990 | 6.8 | 4.6 | 3.8 | 2.7 |
| 1991 | 6.4 | 4.1 | 3.4 | 2.3 |
| 1992 | 6.1 | 4.0 | 3.4 | 2.2 |
| 1993 | 6.3 | 4.2 | 3.4 | 2.4 |
| 1994 | 6.3 | 4.2 | 3.5 | 2.1 |
| 1995 | 6.1 | 4.2 | 3.4. | 2.4 |
| 1996 | 5.6 | 3.9 | 3.3 | 2.3 |
| 1997 | 5.5 | 3.9 | 3.2 | 2.4 |
| 1998 | 5.3 | 3.7 | 3.0 | 2.1 |
| 1999 | 5.3 | 3.6 | 3.0 | 2.2 |
| 2000 | 5.3 | 3.6 | 2.9 | 2.2 |
| 2001 | 5.2 | 3.8 | 3.1 | 2.3 |
| 2002 | 5.4 | 3.9 | 3.2 | 2.5 |
| 2003 | 5.3 | 3.9 | 3.3 | 2.5 |
| 2004 | 5.3 | 4.0 | 3.4 | 2.7 |
| 2005 | 5.4 | 4.1 | 3.4 | 2.7 |
| 2006 | 5.0 | 3.7 | 3.1 | 2.5 |
| 2007 | 5.1 | 3.8 | 3.2 | 2.6 |
| 2008 | 5.1 | 3.7 | 3.1 | 2.5 |
| 2009 | 4.9 | 3.7 | 3.1 | 2.5 |
| 2010 | 5.0 | 3.8 | 3.1 | 2.6 |
| 2011 | 4.9 | 3.6 | 3.0 | 2.5 |
| 2012 | 4.8 | 3.6 | 3.0 | 2.4 |
| 2013 | 5.0 | 3.8 | 3.1 | 2.5 |
Sources:
Section 1 – Statistics Canada, Canadian Vital Statistics, Deaths Database and Birth Database, 2013
Section 2 – Statistics Canada, D. Nagnur. 1986. Longevity and Historical Life Tables: 1921-1981 (Abridged) Canada and the Provinces, 1920/1922 excludes Quebec and Newfoundland and Labrador, 1920−1922 to 1975-1977, catalogue no. 89-506-X. Statistics Canada, Life tables, Canada, provinces and territories, 1980-1982 to 2011-2013, catalogue no. 84-537-X and CANSIM table 053-0003.
Section 3 – Statistics Canada, Canadian Vital Statistics, Deaths Database, 2013 and Annual Demographic Estimates: Canada, Provinces and Territories, 2016, catalogue no. 91-215-X.
- Date modified: