
Condominiums in Canada, 2016 Census of Population

Archived Content
Information identified as archived is provided for reference, research or recordkeeping purposes. It is not subject to the Government of Canada Web Standards and has not been altered or updated since it was archived. Please "contact us" to request a format other than those available.
Release date: October 25, 2017
Description: Condominiums in Canada, 2016 Census of Population
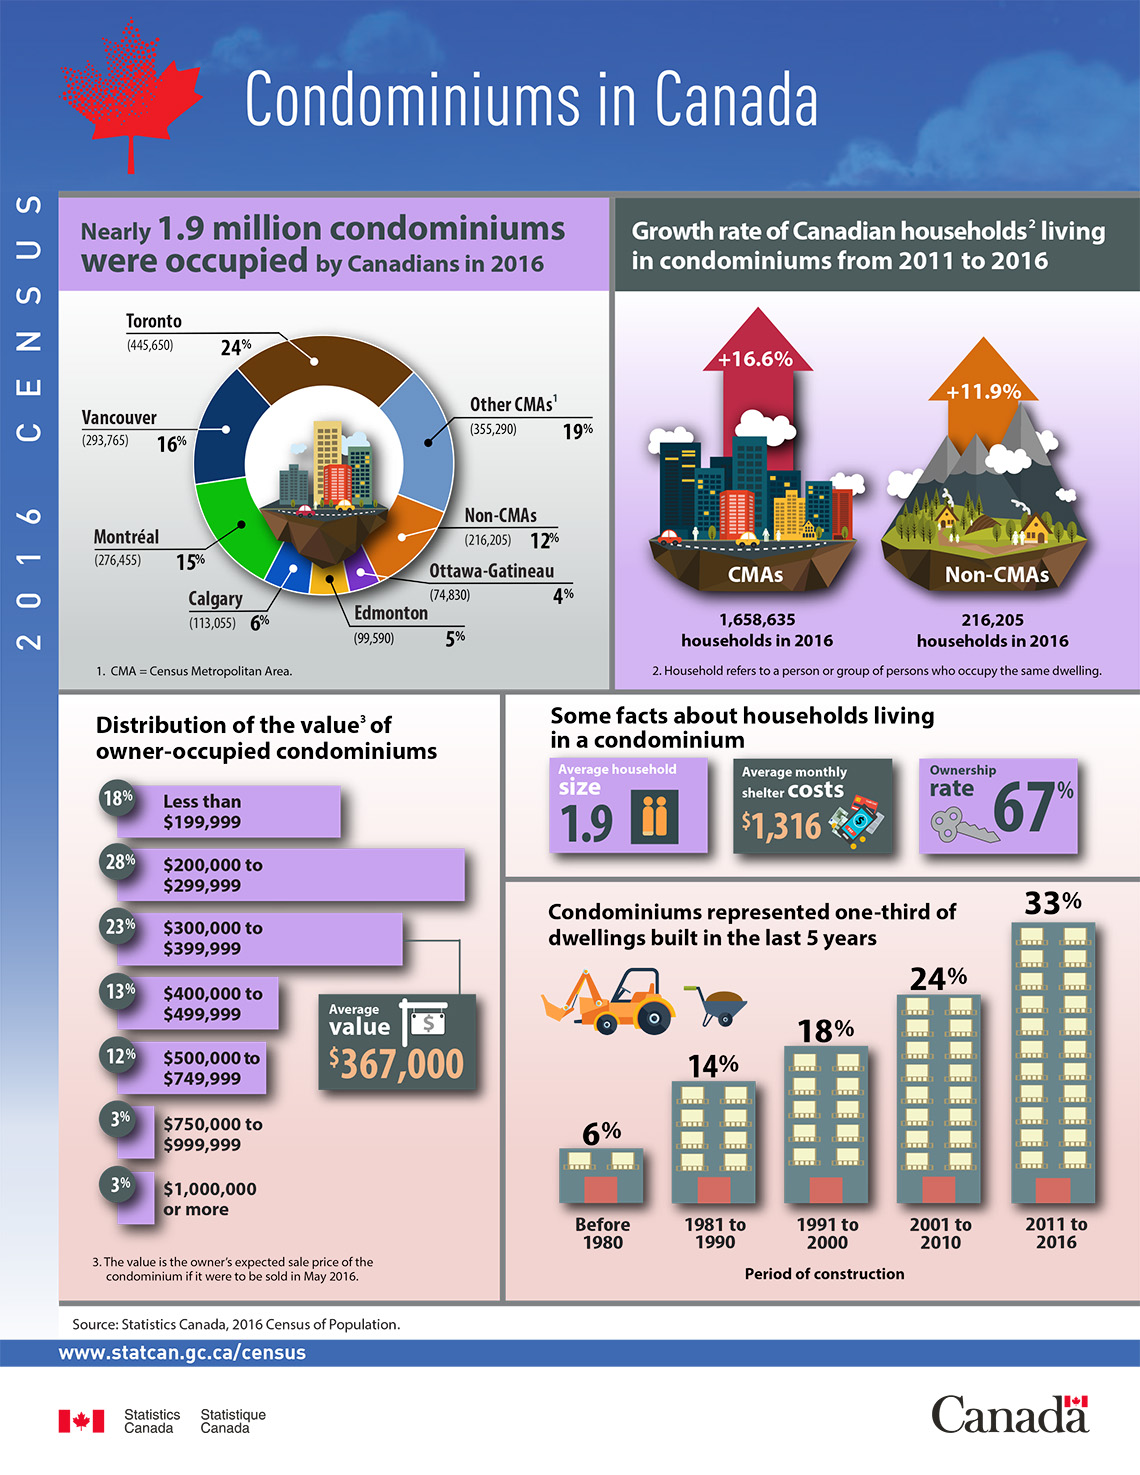
Nearly 1.9 million condominiums were occupied by Canadians in 2016
- Toronto: 24% (445,650)
- Vancouver: 16% (293,765)
- Montréal: 15% (276,455)
- Calgary: 6% (113,055)
- Edmonton: 5% (99,590)
- Ottawa-Gatineau: 4% (74,830)
- Non-CMAsFootnote 1: 12% (216,205)
- Other CMAs: 19% (355,290)
Growth rate of Canadian householdsFootnote 2 living in condominiums from 2011 to 2016
- CMAs: +16.6%
1,658,635 households in 2016 - Non-CMAs: +11.9%
216,205 households in 2016
| Percentage of owner-occupied condominiums | Value of owner-occupied condominiums |
|---|---|
| 18% | Less than $199,999 |
| 28% | $200,000 to $299,999 |
| 23% | $300,000 to $399,999 |
| 13% | $400,000 to $499,999 |
| 12% | $500,000 to $749,999 |
| 3% | $750,000 to $999,999 |
| 3% | $1,000,000 or more |
Average value of owner-occupied condominiums $367,000
Some facts about households living in a condominium
- Average household size: 1.9
- Average monthly shelter costs: $1,316
- Ownership rate: 67%
Condominiums represented one-third of dwellings built in the last 5 years
| Period of construction | Percentage that were condominiums |
|---|---|
| Before 1980 | 6% |
| 1981 to 1990 | 14% |
| 1991 to 2000 | 18% |
| 2001 to 2010 | 24% |
| 2011 to 2016 | 33% |
Source: Statistics Canada, 2016 Census of Population.
- Date modified: