
The Business & Community Newsletter – June 2018

Archived Content
Information identified as archived is provided for reference, research or recordkeeping purposes. It is not subject to the Government of Canada Web Standards and has not been altered or updated since it was archived. Please "contact us" to request a format other than those available.
Feature articles
Keeping up with emerging issues: Statistics Canada Modernization
With the proliferation of mobile technology and the development of Artificial intelligence, society is rapidly changing and becoming ever More complex and sophisticated. Public and private organizations alike have to adapt to keep up.
The speed at which change is happening points to a growing need for better data to drive decisions in a world of increased expectations, data revolutions, ingenuity and innovation and a proliferation of data providers. Statistics Canada is not immune to this new societal revolution. In fact, the agency is undertaking a significant transformation and leading efforts to be more responsive to data needs by:
- Moving beyond a survey-first approach with new methods and integrating data from a variety of existing sources
- Making data easier to access and use by adopting new tools to analyze and visualize data
- Enabling Canadians use data to make evidence-based decisions
 On May 16, 2018 at the Government of Canada's Beyond 2020 Ontario Innovation Fair at Toronto's Mattamy Athletic Centre (former Maple Leaf Gardens) Lynn Barr-Telford, Director General at Statistics Canada talked about how Statistics Canada is modernizing in today's rapidly changing data landscape. Using case studies of cannabis legislation and the opioids crisis, she talked about some innovative approaches to data development being explored at Statistics Canada including a new rapid stats survey mechanism.
Modernizing every step of the cycle
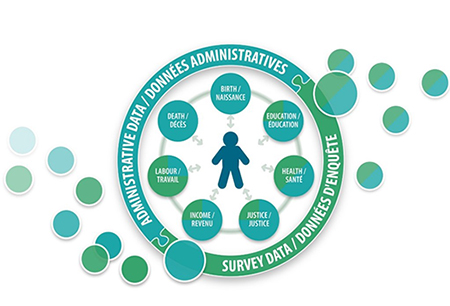
The department is looking at every aspect the survey cycle to improve our products in support of evidence based policy. From the outset, the goal is to support quality decisions by citizens, their governments and businesses based on evidence by maximizing the use of administrative/big data, better integrating data from a variety of sources. Statistics Canada aims to expand access to high value products and services, and improve analysis and visualization tools to evaluate and support responsible data use.
Rapid Stats
An important component of the change in methodology for survey collection is the Rapid Stats infrastructure. This methodology includes the use of electronic questionnaires with possible follow-up by interviewers. The surveys are limited to 5 standard demographic questions and 15 to 22 content questions, simple question content and minor flows. The result is a master data file, publication of an article, Infographic, tables in 90 working days, start to finish. This new infrastructure was used on the National Cannabis Survey. The survey used crowdsourcing to ask about health, justice, economic and price issues related to cannabis in light of the upcoming changes in legislation.
Artificial intelligence and machine learning
Artificial intelligence (AI) and machine learning has a practical role to play in the collection of data. For example, combining traditional methods with AI in the 2016 Census, the department was able to improve immigration variables used to fill in missing values and identify best combination of respondent characteristics to make corrections. AI is also being used to improve Consumer Price Index and retail data and improve statistics on the economic impact international tourism.
Leading Edge
The department is always looking for other methods and partners to complement traditional and new methodologies. For example, it has partnered with the City of Surrey, BC to conduct the Opioid Data Collection and Community Response Project with an aim to better understand the various socio-economic and health-related factors of individuals with an elevated risk for opioid misuse and overdose. The department is seeking opportunities to talk with various people of all walks of life.
The audience on May 16 was made up of public servants from the Federal and Ontario governments as well as municipalities and students. "It was a great opportunity to really talk about the initiatives to an audience with a variety of perspectives." She feels that Statistics Canada, as the national statistical agency can only benefit from reaching out to as many as possible. "If we are to reach our goals, it is important for us to be able to be out there and get questions and feedback."
Sustainable Development Goals Data Hub
 The 2030 Agenda and the Sustainable Development Goals (SDGs) were adopted on September 25, 2015, by the United Nations General Assembly. The 17 SDGs are a universal call to action to end poverty, protect the planet, and ensure that all people enjoy peace and prosperity. They cover a broad range of social and economic development issues, with a focus on the most vulnerable and a commitment that "no one will be left behind."
To measure and monitor progress on the SDGs, on May 16, the government of Canada is launched the SDG Data Hub, hosted by Statistics Canada.
The SDG Data Hub is the result of a partnership among several federal government departments. Data include indicators on health, education, income, agriculture, official development assistance, the economy and gender equality. Canada's statistics for the global indicators related to life on land, water and air are also included.
For example, for Goal 3—Good Health and Well-being—data show that the mortality rate related to unsafe water, sanitation or lack of hygiene declined from 2013 to 2014, while the mortality rate attributed to unintentional poisoning increased slightly.
According to data presented for Goal 5—Gender Equality—women spent 4.1 hours on unpaid work in an average 24-hour day in 2015, 60 minutes more than their male counterparts. Overall, both women and men spent less time on unpaid work in 2015 than they did in 2010, and the gap narrowed between men and women relative to time spent on unpaid work.
For Goal 12—Responsible Consumption and Production—data show that household energy consumption declined 2.0% from 2014 to 2015, while household water use fell 7.6% from 2011 to 2013.
To find out more, consult the SDG Data Hub.
Transportation Data and Information Hub
 On April 13, 2018, Statistics Canada and Transport Canada launched the Transportation Data and Information Hub. The hub provides Canadians with online access to comprehensive statistics and measures on the country's transportation sector.
The Transportation Data and Information Hub offers an array of information on the rail, road, air and marine modes. It also provides new performance indicators, such as truck wait times at border crossings.
Updated monthly, the Hub features data, analysis, maps, infographics and performance indicators. The interactive tools can be used to examine, for example, the cargo handled at specific Canadian ports, the number of international travellers entering Canada by border crossing, the types and volume of freight shipped by rail and truck, as well as the number of passengers travelling through Canada's airports.
To find out more, consult the Transportation Data and Information Hub.
Numbers in Focus
Numbers in Focus - Working
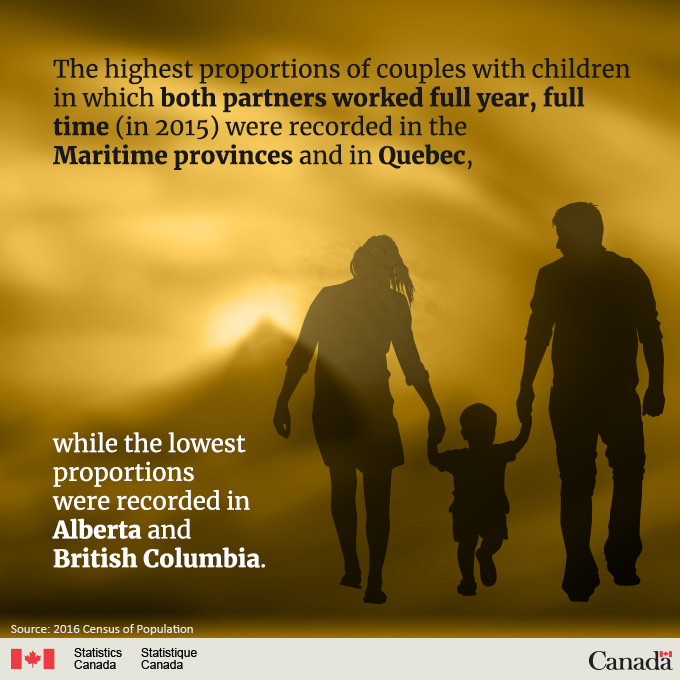
The highest proportions of couples with children in which both partners worked full year, full time (in 2015) were recorded in the Maritime provinces and in Quebec, while the lowest proportions were recorded in Alberta and British Columbia.
Source: 2016 Census of Population

Numbers in Focus - Victimization
-67%
Decrease in rate of self-reported violent victimization for Lesbians and Gays, 2009 to 2014.
Source: 2014 General Social Survey (GSS) on Canadians' Safety (Victimization)
Did you know…?
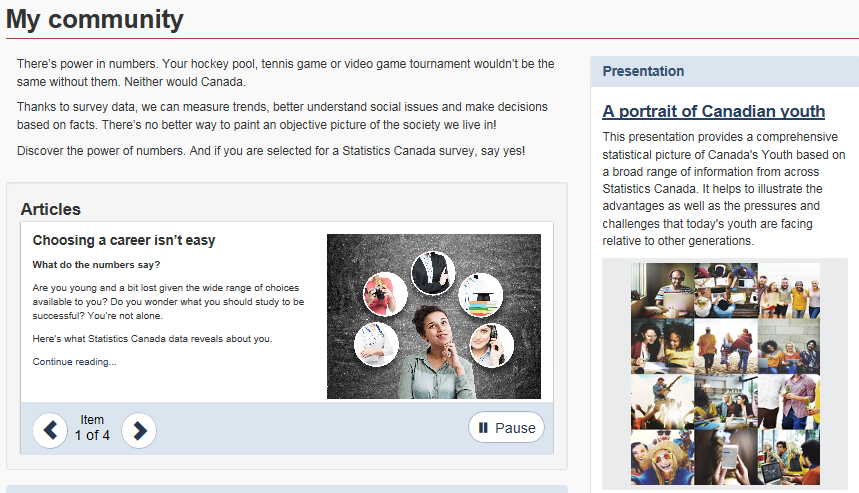
Statistics Canada's pilot project aimed at Millennials
Statistics Canada recently launched a pilot project aimed at Montréal millennials between the ages of 18 and 34, to raise awareness of Statistics Canada's surveys and encourage millennials to participate if they are selected. The campaign will run until September 2018.
A range of products, including articles and video capsules, on topics of interest to young people, were created to showcase how survey data can be useful to them and help make their lives easier. Products are available on Statistics Canada's website and more will be added throughout the campaign.
To help spread the word about the campaign, we have reached out to various organizations and asked them to join the #TheresPowerInNumbers conversation and to follow our social media accounts on Facebook, Reddit, Twitter and YouTube.
For more details about this pilot project, visit our website at www.statcan.gc.ca/mycommunity.
Free Statistics Canada Webinars
The National Webinar Team is presenting the webinar Navigating Statistics Canada's Website on Tuesday June 26 & Thursday June 28, 2018.
On June 4th, Statistics Canada launched some improvements to the StatCan website.
This webinar will provide you with a tour of our new website, assist you with searching the data holdings and show you how to locate and download data with ease.
During the webinar, we will:
- Explore the main sections of the website, including The Daily, Key Indicators, Information and Services, and Features
- Browse data by subject
- Access data, analytical products and reference materials through searching, sorting and filters
- Find information by geography
- Customize retrieved data
We have recently made improvements to the Statistics Canada website.
Interested in learning more about the changes?
Please follow the link to our free webinar Navigating Statistics Canada's Website and register today.
English webinars:
- Tuesday, June 26, 2018 at 1:00 pm, Eastern Daylight Time: Register
- Thursday, June 28, 2018 at 10:00 am, Eastern Daylight Time: Register
French webinars:
- Tuesday, June 26, 2018 at 10:00 am, Eastern Daily Time: Register
- Thursday, June 28, 2018 at 1:00 pm, Eastern Daily Time: Register
Also worth reading
Cannabis statistics
 On May 13, 2017, Government of Canada has tabled legislation that proposes to legalize the production, distribution and consumption of cannabis for non-medical use. If this legislation is approved, all levels of government will need sound statistical information to support the development of policies and regulations.
To meet this information need, Statistics Canada continues to release a variety of cannabis-related data.
Did you know:
- In 2012, 42.5% of Canadians aged 15 years and older reported using cannabis in their lifetime.
- There were 44,301 incidents of cannabis possession in Canada in 2016.
- Canada's 55 licensed cannabis producers reported that 8.7 hectares of greenhouse cultivation area were in active use in 2016.
- In 2017, about 4.9 million Canadians aged 15 to 64 spent an estimated $5.6 billion on cannabis for medical and non-medical purposes.
- Cannabis consumers identified dried flowers (78%), edibles (28%) and hashish (11%) as the most commonly used types of products consumed within the past three months.
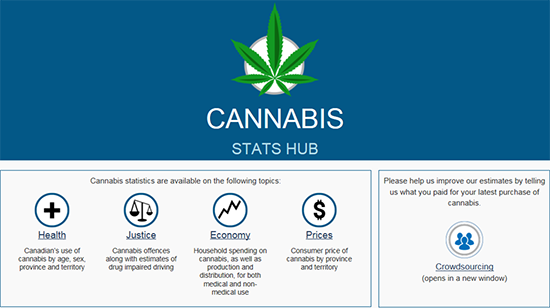
Looking for information on cannabis and not sure where to start? Check out the Cannabis Stats Hub, where you'll find economic, health, justice and social statistics. The Hub is continually updated with new information.
Explore Statistics Canada's crowdsourcing platform, StatsCannabis, which invites Canadians to help Statistics Canada produce estimates by sharing information about their latest transaction. According to March 2018 StatsCannabis data, the average price of cannabis in Canada was $6.96 per gram.
For more interesting cannabis statistics, check out the following:
- Association between the frequency of cannabis use and selected social indicators
- Provincial and Territorial Cannabis Economic Accounts
- A snapshot of licensed cannabis producers
- National Cannabis Survey first quarter results and infographic
- Using municipal wastewater to measure Canadians' consumption of cannabis and opioids
- Analysis of trends in the prevalence of cannabis use in Canada
- Cannabis Economic Account
- Experimental Estimates of Cannabis Consumption in Canada
- A cannabis economic account – The framework
- Preparing the statistical system for the legalization of cannabis.
Infographics
Protein sources in the Canadian diet
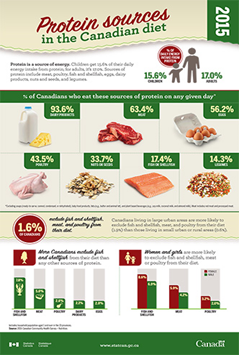 This infographic, Protein sources in the Canadian diet, depicts the percentage of daily energy intake from protein for children and adults, as well as the percentage of Canadians who consume various protein sources on any given day. Percentages of Canadians reporting food exclusions by food category and sex are also presented.
Time to eat
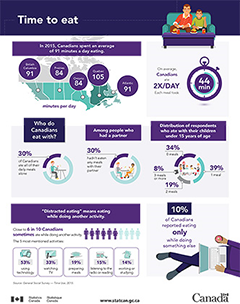 This infographic, Time to eat, illustrates the average time Canadians spent eating in a typical day in 2015 by region. It also answers the question "Who do Canadians eat with?" and defines "distracted eating."
Consumer Price Index, April 2018
The Consumer Price Index (CPI) rose 2.2% on a year-over-year basis in April, following a 2.3% increase in March.
12-month change in the provinces
Prices rose less on a year-over-year basis in five provinces in April compared with the previous month.
At the national level, consumers paid 6.3% more for energy year over year in April. Gasoline prices were the largest contributor to the increase in energy prices in all provinces except Newfoundland and Labrador. This increase was partly attributable to temporary supply disruptions at oil refineries, as they transitioned to summer fuel blends. Electricity prices in Alberta grew 38.9% year over year in April, as higher market prices led to increases in residential electricity rates.
Consumer prices rise at a slower rate in five provinces
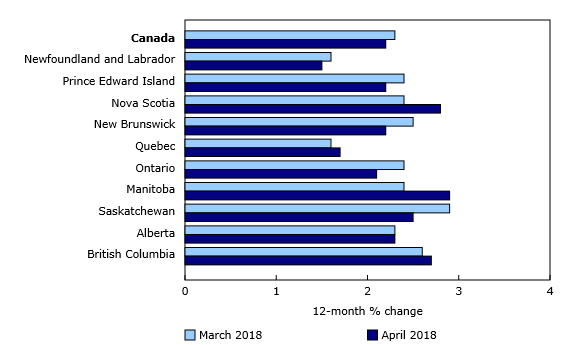
Description for Chart - Consumer prices rise at a slower rate in five provinces
| March 2018 | April 2018 | |
|---|---|---|
| Canada | 2.3 | 2.2 |
| Newfoundland and Labrador | 1.6 | 1.5 |
| Prince Edward Island | 2.4 | 2.2 |
| Nova Scotia | 2.4 | 2.8 |
| New Brunswick | 2.5 | 2.2 |
| Quebec | 1.6 | 1.7 |
| Ontario | 2.4 | 2.1 |
| Manitoba | 2.4 | 2.9 |
| Saskatchewan | 2.9 | 2.5 |
| Alberta | 2.3 | 2.3 |
| British Columbia | 2.6 | 2.7 |
Source: CANSIM table 326-0020
- Date modified: