
Chapter 4.1: Disseminating data through the website
Context
For national statistical offices, a website is much more than an information tool: it is a powerful communication medium. Because websites must evolve in lockstep with new technologies, they require constant and ongoing updating and improvement in order to remain accessible and relevant to their various users' needs.
The Statistics Canada website is a model for statistical data dissemination nationally and internationally. The website is Statistics Canada's most important dissemination tool—it provides access to timely, relevant, and high-quality statistical information on the country's economy and society that meets the needs of Canadians.
Nationally, Statistics Canada was among the first federal departments to venture onto the Internet. The Statistics Canada website was launched in 1996 with The Daily as its only content. Over time, content was added to the website as Internet use increased.
With over 25 million visits per year over the last number of years, Statistics Canada is among the most visited Canadian government websites. The agency publishes statistical information that includes studies, reports, research papers, statistical tables, methodology documents, and other information on a diverse set of subjects to give Canadians an in-depth view of the country's economy and society.
The website includes the following:
- the official release bulletin: The Daily
- two large output databases (Canadian Socioeconomic Information Management System (CANSIM), imports and exports)
- thousands of data tables;
- census modules, including community profiles, highlight tables, topic-based tabulations, and data visualization tools
- major modules for browsing information: "Statistics by subject"; "Information for analysts and researchers"; "Information for survey participants"; "Stay connected" (including blogs, chat sessions with experts, and a video centre).
The website serves very diverse user needs in terms of breadth and depth of statistical expertise. Journalists, economists, researchers, policy makers, high school students, businesses, nongovernmental organizations, and the general public access the website on a daily basis. The agency must ensure that information is presented in a way that suits their needs and levels of expertise.
The widespread use of the Internet confirmed that, while traditional models of dissemination are effective for some audiences, information publishers have moved from more traditional publication formats to data-driven approaches. In the wake of other national initiatives (United Kingdom, United States of America and Australia) to give free access to data in a reusable format, the Government of Canada launched its Open Data Portal in March 2011. Statistics Canada fully supports the Open Data initiative, and the portal includes datasets from Statistics Canada that represent an important portion of the overall data published by the agency. In fact, Statistics Canada developed this version of the open data portal and operates it on behalf of the Treasury Board SecretariatEndnote 1. The Open Data initiative requires the publication of data in machine-readable and reusable formats, non-restrictive licenses, and open standards. Statistics Canada is aligning its dissemination objectives with the principles of open data (see details in section 3 of this chapter, on the New Dissemination Model).
Today all Statistics Canada's aggregate data can be found not only on the agency's website, but also on the Government of Canada Open Data Portal.
Strategies, mechanisms and tools
Given the importance of this dissemination and communication outreach channel, statistical organizations should apply the following strategies when reviewing, monitoring and improving their websites' content and usability and their management practices and operations regarding the dissemination of data:
- Seek feedback from users through consultations and other means.
- Move towards free data and easier access to data.
- Continually modernize the way statistical information is disseminated.
1. Consultations, feedback, and metrics tools
To ensure the relevance and efficiency of their websites, statistical organizations need to continually be aware of, and understand, the needs of their various audiences. To this end, they can conduct consultations and seek their users' feedback through a variety of channels. Statistics Canada relies on four complementary sources of information to understand its Web presence and gather evidence on visitors, expectations, and patterns used to navigate through the website.
- Consultations with users – Statistics Canada systematically applies a robust program of user consultations. This program focuses on usability testing for major Web developments, including Web module redesign, the "Search" function, new Web content, and navigation improvement and simplification.
- Website Evaluation Survey (WES) – Online surveys have been conducted periodically since 1997 to measure users' satisfaction with the website; identify successes and opportunities; and obtain feedback on recent improvements. As well, since 2010, the WES has been measuring the task completion rate for its respondents. It is important to note that the WES is conducted with a self-selected sample of site visitors. Through the WES, Statistics Canada receives feedback from 10,000 website visitors annually.
- Internet Visitor Pattern Analysis (VPA) – Statistics Canada has conducted several VPAs to gain insight into the behaviour of visitors to the website. VPAs use quantitative data (log files over a period of 6 months in 2009 and 12 months in 2010) to derive relevant information about visitors' profiles, visit duration, top navigation, content preferences, brand recognition, etc.
- Web metrics – Quantitative information has been gathered daily since 1997 from log files of web servers. The information is organized by means of the Web Trends Interactive tool to produce summary reports on visits, downloads, and overall use of the website.
2. Moving towards free data and easier access to data
The Web enables statistical agencies to provide greater access to statistics and metadata and to do so at a lower cost. The detail made available is no longer limited by the size of the publication as it was for print publications. Disseminating statistical products through a website enables statistical organizations to move towards more versatile, interactive, impartial, timely and cost-effective access to information.
In Canada, a significant step towards freeing more data was taken in February 2012, when the CANSIM database and self-standard products became free of charge. License restrictions have been removed as well. This major Statistics Canada initiative is in line with the open-data approach maintained by the Government of Canada, which has been also successfully adopted by many other countries.
Providing this vast repository of information free of charge has increased its use by one of the site's main audiences: the general public. To meet another long-standing user need (making it easier for users to access data) and improve task completion for new visitors to the site, a new user interface for CANSIM was developed and launched, also in February 2012. The interface drew upon best practices in online data publishing to provide site visitors with an initial view of the data in fewer than three clicks. From that initial view, they have the opportunity to customize their tables (layout and information) to their specific needs. Decisions regarding the new interface have been based on user consultations and usability testing results.
To increase access to statistical information by Canadians, Statistics Canada conducted a comprehensive review of its standard products to set new criteria and business rules for identifying products that should be disseminated on the website. The criteria reflected users' needs, product availability for Web dissemination, and the level of effort required to move to the online channel.
3. Continually modernizing the way statistical information is disseminated: adopting the New Dissemination Model from Statistics Canada
The advent of information and communication technologies has opened up more and more possibilities for providers and users of statistics. To ensure relevance and to take advantage of the new technologies, statistical organizations must make sure that their dissemination services and tools also evolve over time. In some cases, this may require significant redesign of their current tools.
In Canada, this redesign is being carried out through a modernization initiative called the New Dissemination Model. The objective of this project is to develop methods and a framework for better dissemination of data to the public, with a main focus on aggregate statistics. This major project has been approved and managed as a Corporate Business Architecture project and is being overseen by multidisciplinary governance committees, including an external advisory panel that is user driven.
3.1 There are five key drivers for this new model:
- the need to consider a more data-driven approach, which focuses less on traditional publication formats
- the need to address the lack of coherence in how aggregate data are organized for dissemination and how data are presented
- the need to respond to the pressure to move towards open data, that is, to make more data available free of charge, free of licensing restrictions, and in machine-readable formats that increase data use
- the need for a single catalogue or registry of Statistics Canada products, which will permit better navigation through the agency's information holdings
- the need for greater efficiency through streamlining core systems, technologies and standards.
3.2 Advantages of the New Dissemination Model
The advantages of Statistics Canada's dissemination model are the following:
- A new, single, mandatory output database to present and disseminate data to the public that provides a common and consistent interface for all data products.
- A radical simplification of the product line (standardized containers and processes adopted uniformly throughout the organization) in terms of the way data are organized. This simplification integrates the following features:
- Consistent look and feel, functionality, and interconnectivity (crosswalks) across the website;
- Main entry point: either "Search by subject" or "Search by geographic area" using a mapping application;
- Key single-number indicators (unemployment rate, consumer price index, gross domestic product, for example);
- High-level / day-of-release summary table and analysis.
- Easier access and improved organization and navigation.
- An output metadata framework.
3.3 Project scope
The first year (2012/2013) focused on the preparation of a detailed blueprint for the new model, which is based on corporate experience, existing metrics and user feedback, as well as wide consultations with Statistics Canada's user community (internal and external).
Subsequent years (2013/2014 and 2014/2015) of the project are focused on development, testing and implementation of the New Dissemination Model, as outlined in the blueprint. Years 4 and 5 are dedicated to full deployment and implementation (2015/2016 to 2016/2017).
3.4 The pyramid concept: offering different levels of materials to a large range of users
The pyramid approach (see figure 4.1) consists in offering different levels of materials to a large range of data users: from simple indicators to more complex data; from users who just want a single number, to those looking for a simple reference table or a more detailed view.
Figure 4.1.1: Statistics Canada's pyramid approach to its dissemination model
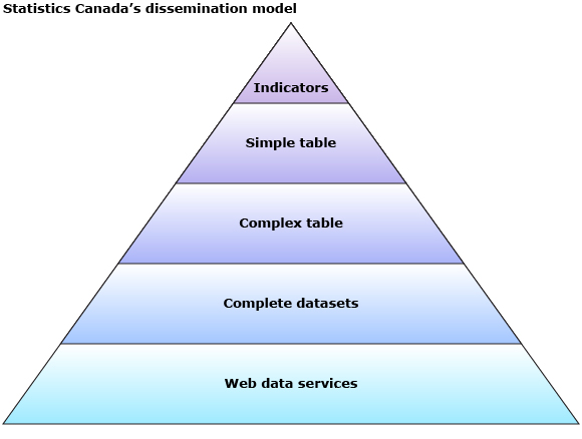
Description of Figure 4.1.1
This represents the pyramid of the Statistics Canada's dissemination model. There are five layers to the pyramid.
- Indicators.
- Simple table.
- Complex table.
- Complete table.
- Web data services.
3.5 Consultation activities and user feedback
To ensure the adoption of a dissemination strategy responsive to users' needs, consultations were conducted in the form of
- in-person group consultations based on a discussion guide containing specific points for discussion with users
- online consultations with diverse user groups
- usability-testing activities to get feedback on users' experience (search and navigation).
Business intelligence analysis and other research, in the form of analysis of Web metrics and research of best practices in other national statistical organizations, were also conducted.
3.6 Governance structure
Undertaking the complete redesign of a statistical organization's main dissemination media requires strong governance for the organization to exercise proper control over the project, while ensuring that its implementation and final outcomes are coherent with its practices and policies. At Statistics Canada, as explained in the Departmental Project Management Framework Guidelines, the governance of CBA projects, including the New Dissemination Model, is assured by several governance committees:
- The Executive Management Board is the organization's senior governance body (composed of the Chief Statistician and Statistics Canada's five assistance chief statisticians);
- The Project Steering Committee is responsible for the business issues associated with projects;
- The Field Planning Board monitors project execution and produces a quarterly report;
- The Corporate Business Architecture Management Committee monitors application of CBA pre-approved plans;
- The Systems Architecture Review Board focuses on projects that include an information technology (IT) component. This board ensures that IT systems are developed following sound architectural principles, using a set of tools and methods, and in a way that meets the business needs of the agency and the IT security policies of both Statistics Canada and the Government of Canada.
An external expert advisory panel was also established to enlist the input and expert advice from a variety of key user groups, as well as experts from the information and statistical industries.
Key success factors
Statistics Canada's experience shows that planning and implementing targeted, relevant and timely communications activities has been key to the success of the planning and implementation of the New Dissemination Model. Based on effective teamwork by the Dissemination and Communications teams, efforts, coordination and synergy have helped ensure that consultations and communications regarding scope, important milestones, and timelines are taking place. Also the teams ensure that relevant information is communicated, both internally with employees, and externally with stakeholders and users.
In addition, the use of Web 2.0 collaboration tools (such as blogs and online chat sessions with experts) and social media (platforms on YouTube and Twitter) have been very effective in increasing interactions with users and traffic to the website.
Finally, the dissemination of all Statistics Canada's aggregate data on the Government of Canada Open Data Portal was facilitated in two ways:
- by adopting early the principles of open data, and by complying with new government directives while disseminating information through the website;
- by playing a behind-the-scenes role as the operating organization in charge of maintaining the Government of Canada Open Data Portal.
Challenges
Websites can become both voluminous and complex. To keep the Statistics Canada website relevant to its wide variety of users, who have different needs and make different uses of the data, its content needs to be constantly reviewed and managed. The website must make available not only static information but also more dynamic content, involving interactive tools (such as data visualization tools, interactive maps and infographics).
In addition, given the rapid evolution of electronic devices, the website must be made accessible by means of various types of electronic devices so that it can be aligned with users' preferences in terms of access to, and use of, the agency's data.
Finally, statistical organizations' websites often have to comply with government rules and regulations. This might require adopting a consistent look and feel, introducing accessibility requirements (e.g., for visually impaired persons), and composing with interconnectivity constraints across the website, to name a few. Strong governance is again essential to maintaining knowledge of, and compliance with, these rules and regulations.
Looking ahead
Statistical organizations must continue to seek opportunities for meeting the evolving needs of their data users. They must do this by adopting new data formats, government standards on accessibility, and data visualization tools, while ensuring the security and flexibility of their respective dissemination infrastructures. It is important to mention that, given the massive evolving need and appetite for the Internet and its various uses, the challenge will be to strategically prioritize in this regard and to determine what must be done as regards the organization's core function to allow free and easier access to data—while encouraging others to take the lead in reusing and redistributing the data thorough their own channels.
Endnotes:
- Endnote 1
-
The Treasury Board of Canada is a government central agency.
Bibliographie
Beaudoin, G. (2009). Beyond Web Archiving, Sustainable Content Management, Presentation to the International Marketing and Output Database Conference, Statistics Canada.
Government of Canada. Open Data Portal. Consulted on the 11th of March 2016 and retrieved from http://open.canada.ca/data/en/dataset.
Statistics Canada. Strategic Plan for the Statistics Canada Website (Fiscal years 2013/14 to 2015/16), Dissemination Division. Internal document. Accessible on demand.
Statistics Canada. Statistics Canada's website. Consulted on the 11th of March 2016 and retrieved from www.statcan.gc.ca.
- Date modified: