
Figure 2.1
Built-up area growth, census metropolitan areas of Canada, 1971 to 2011
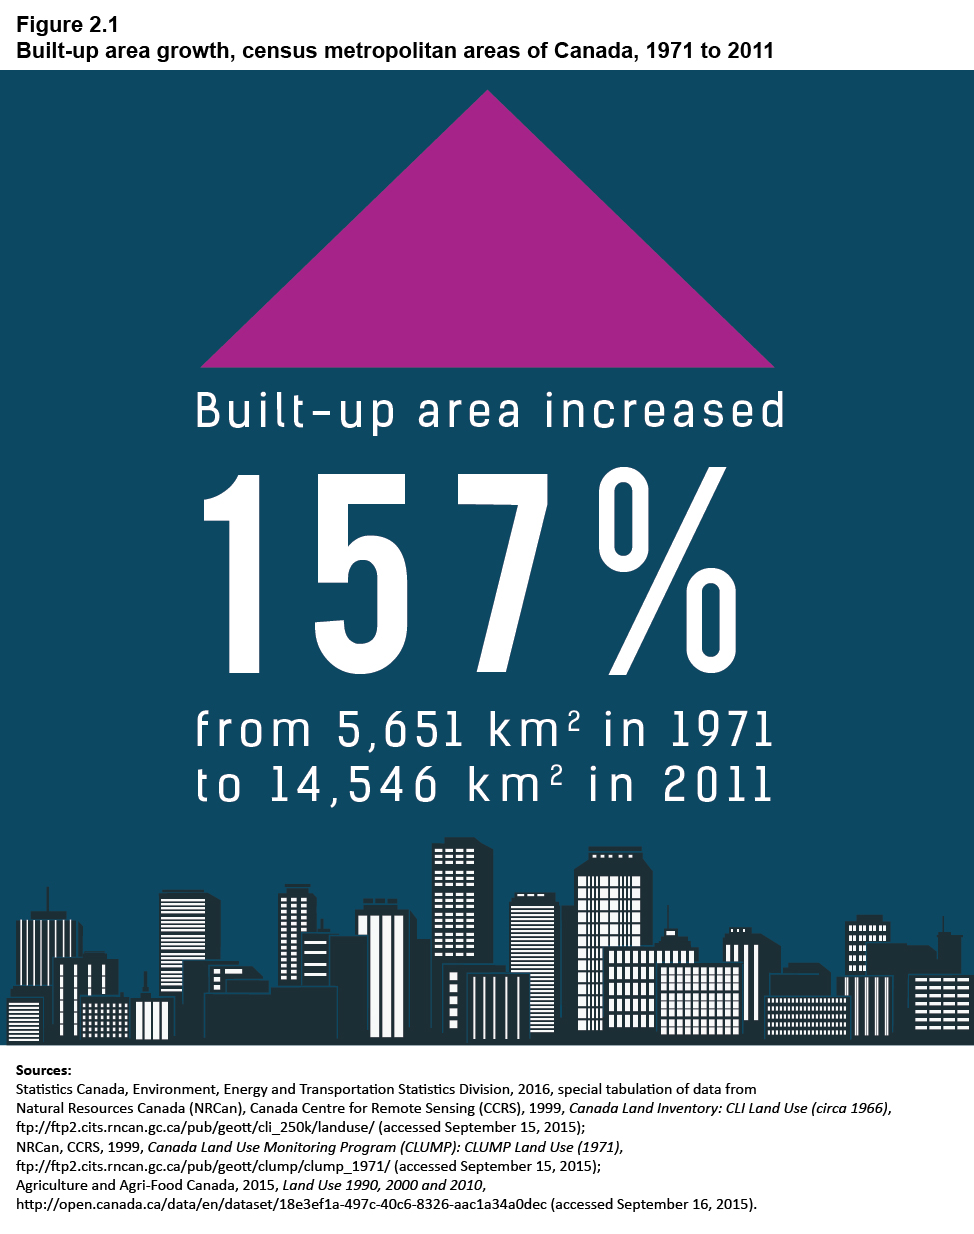
Description of Figure 2.1
Built-up area increased 157% from 5,617 km2 in 1971 to 14,546 km2 in 2011.
Source(s): Statistics Canada, Environment, Energy and Transportation Statistics Division, 2016, special tabulation of data from Natural Resources Canada (NRCan), Canada Centre for Remote Sensing (CCRS), 1999, Canada Land Inventory: CLI Land Use (circa 1966), ftp://ftp2.cits.rncan.gc.ca/pub/geott/cli_250k/landuse/ (accessed September 15, 2015); NRCan, CCRS, 1999, Canada Land Use Monitoring Program (CLUMP): CLUMP Land Use (1971), ftp://ftp2.cits.rncan.gc.ca/pub/geott/clump/clump_1971/ (accessed September 15, 2015); Agriculture and Agri-Food Canada, 2015, Land Use, 1990, 2000 and 2010, http://open.canada.ca/data/en/dataset/18e3ef1a-497c-40c6-8326-aac1a34a0dec(accessed September 16, 2015).
- Date modified: