
Recent changes in demographic trends in Canada

Archived Content
Information identified as archived is provided for reference, research or recordkeeping purposes. It is not subject to the Government of Canada Web Standards and has not been altered or updated since it was archived. Please "contact us" to request a format other than those available.

[Release from The Daily] [Full article in PDF]
- Overview of the study
- Introduction
- Population growth faster than the national average in the Prairie provinces
- Negative natural increase for the first time
- International migratory increase: An important source of growth in the Prairie provinces
- Increasingly different populations
- Impact of demographic changes on the population share of provinces and territories
- Conclusion
- Notes
- Related material for this article
Start of text box
Overview of the study
Canada’s population growth masks some very different trends from one region to another. Using various data sources, including Statistics Canada’s most recent projections on population and diversity, this article provides a general overview of these trends and discusses how recent demographic changes could impact the age structure, diversity and population share of the various regions of Canada over the next decades.
- Over the period from 2011 to 2014, the three Prairie provinces (Alberta, Saskatchewan and Manitoba) all had faster population growth on average than the national growth, and the highest population growth among the provinces. This is a first since 1971.
- Conversely, population growth in the Atlantic provinces has remained close to zero in recent years. For the first time in the country’s history, more deaths than births were recently recorded in three of the four Atlantic provinces.
- In the mid-2030s, the percentage of seniors aged 65 and over could exceed 31% in Newfoundland and Labrador and reach 18% in Alberta. This difference would then be larger than the one observed in 2014 between Nova Scotia and New Brunswick (18%) and Alberta (11%).
- In 2031, the percentage of individuals belonging to a visible minority could exceed 40% in Ontario, compared with 3% in Newfoundland and Labrador. This difference would then be larger than the one observed in 2011 between British Columbia (27%) and Newfoundland and Labrador (1%).
- If recent demographic trends continue, the population share of the Prairie provinces could surpass Quebec’s in less than 50 years. Moreover, the population share of the four Atlantic provinces could decrease to less than 5% of Canada’s population.
End of text box
Introduction
Since the mid-1990s, Canada’s population growth has changed little, around an average of 1% per year. However, this stability at the national level masks many recent changes in the population growth of the provinces and territories and the factors underlying this growth.
These changes, many of which are likely to continue, could increase the differences in the composition of provincial and territorial populations in the future, and could have an impact on the needs of these populations and the services they will require. These changes could also significantly alter the population share of Canada’s regions.
The purpose of this article is to describe the recent changes in provincial and territorial population growth and the factors that underlie this growth. In addition, some possible consequences of these changes on age structure, ethnocultural diversity and the population shares of the various regions of Canada are presented.
The data used in this article are taken from the Population Estimates Program, the Population Projections Program and censuses available at Statistics Canada (see Data sources, methods and definitions).
Population growth faster than the national average in the Prairie provinces
Since 2007, Ontario is no longer in the top three provinces for population growth as it was between 1979 and 2006. Between 2011 and 2014, these three provinces were the Prairie provinces, i.e., Alberta, Saskatchewan and Manitoba (Chart 1), something that had never occurred in the previous four decades.

These three provinces are also the only ones whose population growth has been on average higher than the national population growth over the last four years.
While Alberta has had the strongest population growth among the provinces since 1997,Note 1 the opposite had been observed a few years ago in Saskatchewan, where the population decreased from 1997 to 2005 (except in 2003, when the growth was zero). Between 2005 and 2007, Saskatchewan went from having a shrinking population to being the Canadian province with the second-highest growth. This growth remained steady at 1.5% or more from 2007 to 2013, and was at 1.3% in 2014.
Manitoba’s population has also grown significantly over the last 15 years—it was 1.3% in 2012, the highest level since 1972.Note 2 In 2014, the growth rate was 1.2%.
There have also been other recent changes in the population growth of Canada’s provinces and territories.
For instance, while Ontario’s population growth rate was systematically higher than the national average from 1982 to 2005, it has been slightly below average since then, including the recent period from 2011 to 2014.
Conversely, Quebec’s population growth rate increased between 2005 and 2009, and, since that time, it has been closer to the national average. Since 2006, Quebec’s population growth became closer to Ontario’s growth rate, and even slightly surpassed Ontario’s growth in 2008 and 2009. Such a situation never occurred during the period from 1971 to 2005, when Quebec’s population growth was significantly lower than Ontario’s.
British Columbia has also posted population growth close to the national average since the late 1990s after frequently showing significantly higher growth, particularly between 1987 and 1997.
Finally, the Atlantic provinces’ population growth remains significantly lower than elsewhere, and has been close to zero since the late 1990s—with the exception of Newfoundland and Labrador in 2008-2010, and Prince Edward Island.
An analysis of the factors behind the different provincial and territorial population growths would appear to indicate that these recently observed trends could continue in the coming decades.
Negative natural increase for the first time
Population growth in the provinces and territories can be broken down into three factors: natural increase, international migratory increase and interprovincial migratory increase (see Data sources, methods and definitions).
At the national level, approximately two-thirds of population growth is currently due to international migratory increase (Chart 2) while the other third is due to natural increase—notably because of a low fertility rate fluctuating around an annual average of approximately 1.6 children per woman.
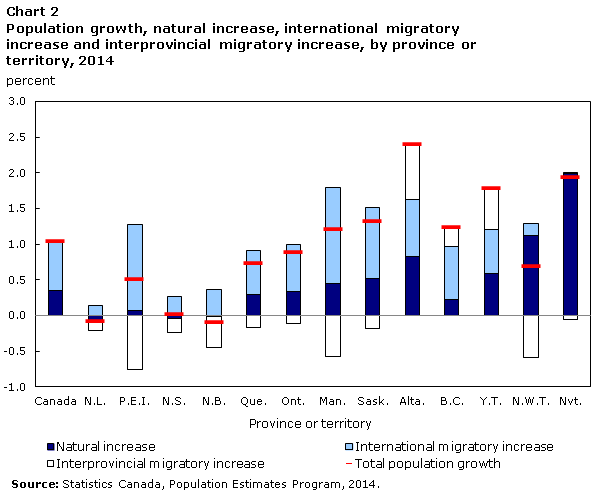
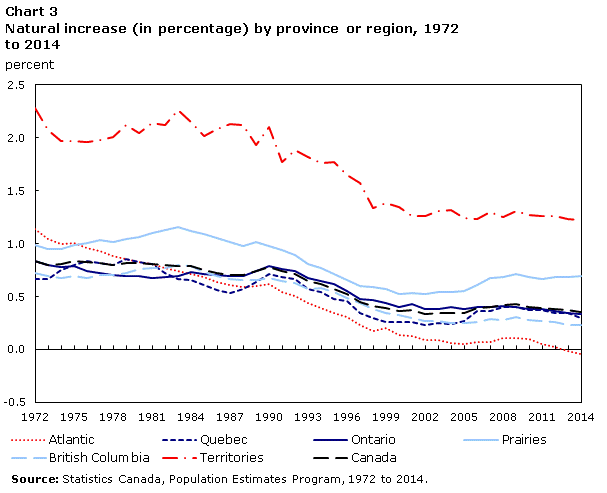
However, natural increase no longer contributes to population growth in the Atlantic provinces. For the first time since 1921 (the first year of available data on this topic), some provinces, all located in the Atlantic region, have had negative natural increases in the past few years.Note 3 In 2014, Newfoundland and Labrador, Nova Scotia and New Brunswick saw more deaths than births, resulting into a negative natural increase for the Atlantic region since 2013 (Chart 3).
Elsewhere, the contribution of natural increase to population growth remains positive, but varies across provinces and territories.
For example, natural increase is still the main factor in Nunavut’s population growth (Chart 2), as the fertility rate in this territory is close to three children per woman on average.Note 4
The contribution of natural increase to the population growth of the provinces and territories should decrease in the next two decades, mainly due to population aging—an increasingly larger amount and proportion of the population will be concentrated in older age groups, when mortality is high.
Accordingly, the population-projection scenarios suggest that the number of deaths will most likely increase more quickly than the number of births in the coming years. The increase in the number of births will be limited by persistently low fertility rates and a smaller proportion of women of childbearing age, particularly in certain provinces or territories that are characterized by weak international migration and by net negative interprovincial migration.Note 5
In the vast majority of Statistics Canada’sNote 6 most recent population-projection scenarios, natural increase could nonetheless remain positive in all provinces west of Quebec over the next two decades.
Conversely, the natural increase would continue to decline in the Atlantic provinces (according to all projection scenarios) and in Quebec (according to most projection scenarios) in the next 20 years.
Such results suggest that to remain positive in the coming years, population growth in these provinces would rely solely on international or interprovincial migration. Moreover, to ensure that their populations keep growing, these provinces will have to attract more and more migrants from year to year if they want to make up a natural-increase deficit that will likely grow. In most years since 1971, these provinces have posted significant losses in interprovincial migration and, in the case of Atlantic provinces, weak gains in international migration (including 2014).
International migratory increase: An important source of growth in the Prairie provinces
One of the most significant changes in recent years was the international migratory increase in the Prairie provinces. The major increase in the population growth rate of Saskatchewan and Manitoba in recent years is primarily attributable to international migratory increases, as these two provinces have been attracting proportionally more international immigrants than in the past. Alberta’s international migratory increase has also been above the national average in recent years. Since 2011, and for the first time since 1972, the international migratory increase is higher in the Prairie provinces (expressed in percentage) than in other regions of the country.
At the same time, fewer immigrants than in the past are choosing to settle in Ontario, which partially explains the slowdown in that province’s population growth. Hence, the international migratory increase in Ontario was more than 1% in the early 2000s, the highest rate for all the provinces and territories. This rate, however, was lower in 2014 at 0.7% (Chart 4). For the first time since 1972, Ontario’s international migratory increase rate was not above the national average in recent years.
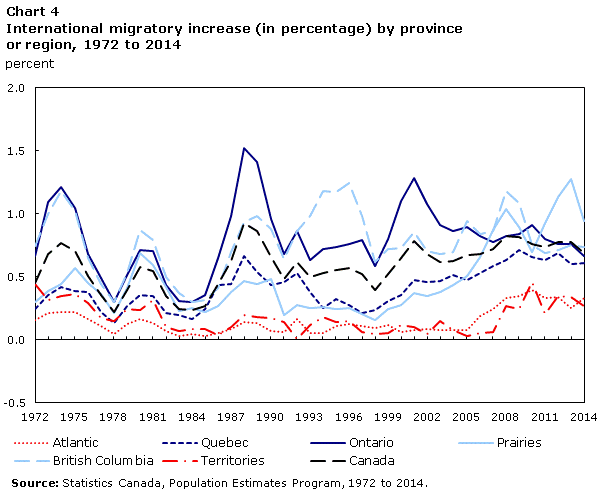
British Columbia has a pattern similar to Ontario’s: while migratory increases were above average for most of the 1990s and 2000, they have decreased recently and have been closer to the national average since 2010.
Despite these recent changes, international migratory increase remain the main source of population growth in Ontario. The same holds true for Quebec and British Columbia.
Finally, Alberta’s strong population growth in recent years has been the result of a combination of strong natural increase, strong international migratory increase and strong interprovincial migratory increase (Alberta was the main beneficiary of migratory exchanges between the provinces and territories in recent years).
Increasingly different populations
The disparity in the sources of population growth from one province or territory led to differences in the population profile of provinces and territories.
Population composition by birthplace, which depends on the magnitude of international and interprovincial migratory increases, is a case in point. According to the 2011 National Household Survey, approximately 1 in 2 individuals living in British Columbia (51%) and Alberta (46%) were born outside these provinces (i.e., abroad or in another Canadian province or territory) (Chart 5).
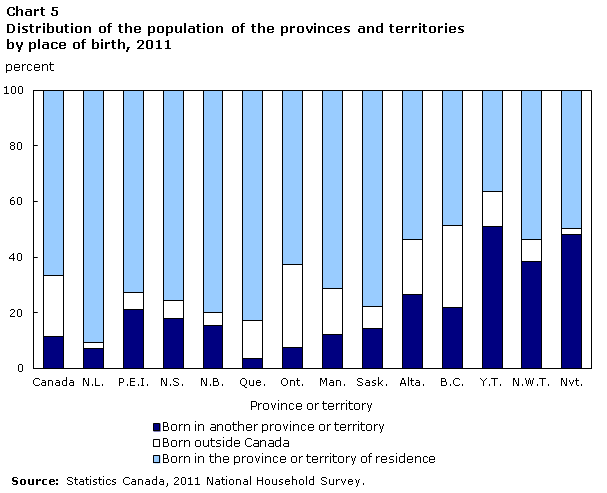
This proportion was also relatively high in the three territories, particularly in Yukon (64%), as the territories often attract a large number of workers from other provinces.
Conversely, 9% of the population living in Newfoundland and Labrador was born outside that province. This proportion was also lower in Quebec than elsewhere (17%).
In Ontario, this proportion was 37% in 2011 (most of these individuals were born outside Canada).
Of all the provinces, Alberta (26%) and British Columbia (22%) had the highest proportion of individuals born in another province, due to the current and past influx of interprovincial migrants.
While natural increase trends are mostly predictable (because they are partially linked to changes in the age structure of the population), the trends associated with international and interprovincial migratory increases are more difficult to predict because they are more likely to be associated with changes in the economy. Many studies have shown the links between migration and the labour market.Note 7
If the various components of population growth (fertility, mortality, immigration, emigration and interprovincial migration) remained steady in the coming years, however, the age structure and ethnocultural diversity of the various provinces and territories could become increasingly different. In addition, the population share of the provinces and territories could change considerably in the next 50 years, making for a very different Canada than today’s or at the time of Confederation.
For example, the population of all the provinces and territories will age over the next two decades. The proportion of individuals aged 65 and over in Canada could increase from 16% in 2014 to 24% in 2034, according to Statistics Canada’s most recent population projectionsNote 8 (Chart 6).
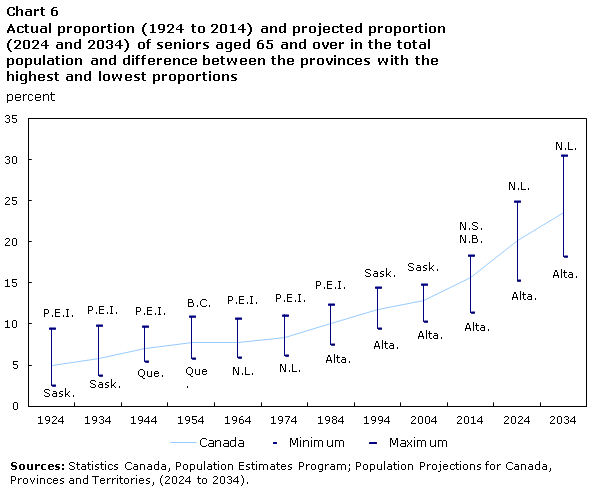
The provincial differences in the proportion of individuals aged 65 and over, however, could increase. In 2014, 7 percentage points separated Alberta—the province with the lowest proportion of seniors (11%)—and Nova Scotia and New Brunswick, which had the highest proportions (slightly above 18%).
Based on the most recent population projections, this difference could increase to 13 percentage points in 2034. Hence, the proportion of seniors in Newfoundland and Labrador could reach 31%, or almost 1 in 3 people, compared with 18% in Alberta. This is because weak population growth is often synonymous with a more rapidly aging population.
By comparison, in 1944, only 4 percentage points separated Quebec, the province with the youngest population in Canada, and Prince Edward Island, the province with the oldest population.
The differences in the population’s ethnocultural diversity could also increase, given that certain provinces attract more international immigrants, and others fewer.
If current immigration levels in Canada were to continue, the proportion of individuals in the population who were born abroad could increase from 22% in 2011 to close to 27% in 2031, or more than 1 in 4 people (Chart 7).
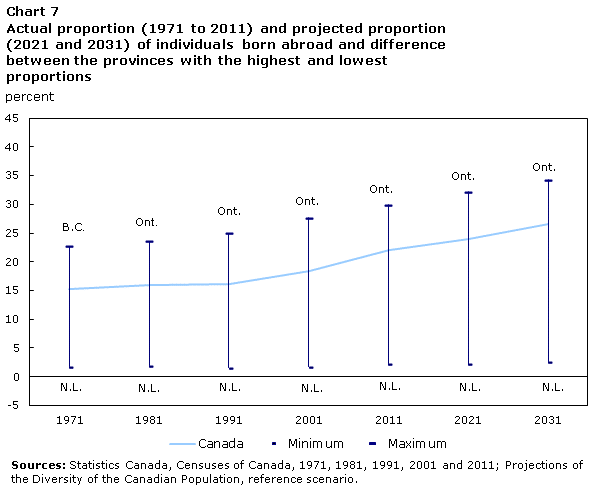
In 2011, 28 percentage points separated Ontario, the province with the highest proportion of people born abroad (30%), and Newfoundland and Labrador, the province with the lowest proportion (2%). In 1991, the gap between these two provinces was smaller (23 percentage points).
This difference could grow to 32 percentage points in 2031—at that time, one-third of Ontario’s population could possibly be born abroad (34%) compared with 3% of Newfoundland and Labrador’s population.
The same trend would apply to the proportion of the population belonging to a visible minority.
In 2011, 19% of Canada’s population (or close to 1 in 5 people) reported belonging to a visible minority, up 5% from 1981. In 2031, this percentage could increase to 31%, or nearly 1 in 3 people, assuming that the source countries of immigration—often Asian countries—remain the same as today’s (Chart 8).
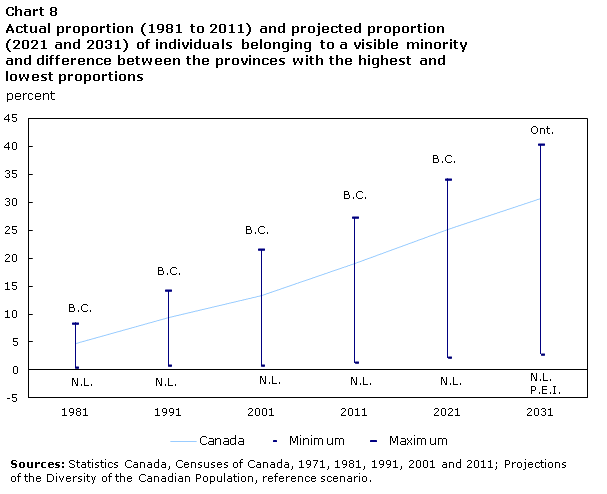
In 2011, the difference separating British Columbia (27%) and Newfoundland and Labrador (1%) was 26 percentage points; this difference could increase to over 37 percentage points in 2031. Moreover, Ontario could become the Canadian province with the highest proportion of individuals belonging to a visible minority (40%), while Newfoundland and Labrador and Prince Edward Island could have the lowest proportions (3%).
Impact of demographic changes on the population share of provinces and territories
Finally, if the differences in the population growth of the provinces and territories continue, they could considerably alter the population share (or demographic weight) of Canada’s regions.
In 1871, a few years after Canadian Confederation, 44% of the population lived in Ontario, 32% in Quebec and 21% in the Atlantic provinces. The Prairie provinces, British Columbia and the territories represented barely 3% of the population living in what was Canadian territory at the time (Chart 9).
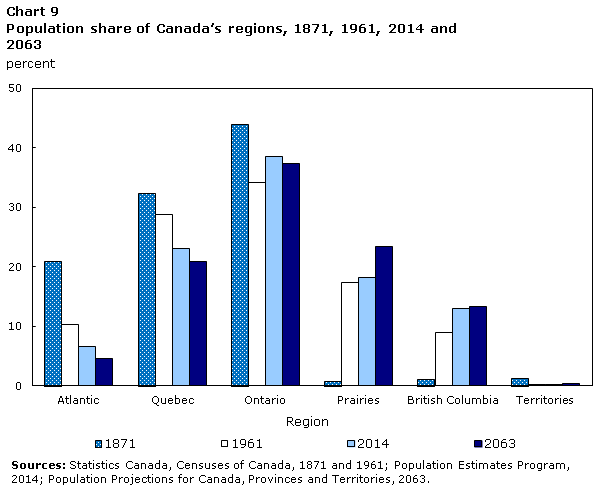
More recently, in 1961, the population share of the Atlantic provinces was higher than that of British Columbia (10% versus 9%) and only 5 percentage points separated the population shares of Quebec (29%) and Ontario (34%).
In 2014, the Atlantic provinces made up 7% of Canada’s entire population. Nearly 2 in 5 Canadians lived in Ontario (39%), and the difference between this province and Quebec (23%) had increased to 16 percentage points. Lastly, in 2008, the population share of the provinces west of OntarioNote 9 became higher (31%) than the share of the provinces east of Ontario (30%)Note 10 for the first time in the history of the country.
If the recent demographic trends remain steady until 2063, or nearly 200 years after Confederation, the population share of the Prairie provinces (24%) could exceed that of Quebec (21%). The Atlantic provinces’ weight could represent less than 5% of Canada’s population, while the population share of Ontario could decrease slightly.
Conclusion
Throughout Canada’s history, changes in population growth and age structure have had many repercussions for Canadian society, for example on infrastructure needs, social programs, and the political influence of the various regions of the country.
As demographic trends—some recent, such as negative natural increases or the significant contribution of international immigration to population growth of some regions—will continue to have an impact on Canada in the coming years, it is important to shed light on how these changes will affect the various regions of the country if current trends continue. Certain recent trends will probably have an impact on many other aspects of Canadian society, such as ethnocultural and linguistic diversity.
This article has shown that current population growth trends, the factors underlying this growth, and the age structure should continue to contribute to the growing demographic differences from one region of the country to another.
In the Atlantic region, population growth could remain weak—even negative—in the coming years, particularly due to ever-declining natural increases. As a result, these regions could see their populations age more quickly than elsewhere, with less ethnocultural diversity.
Conversely, the population share of the Prairie provinces could continue to increase if population growth remains as high as is it has been in recent years. In these provinces, significant natural increases very often go hand in hand with international migration, and, in Alberta, interprovincial migration could result in faster population growth than elsewhere in the country. These provinces could therefore continue to have younger-than-average populations and show an increasing ethnocultural diversity in the coming years.
Laurent Martel is Chief of the Demographic Analysis and Projections Section in Statistics Canada’s Demography Division.
Notes
Additional information
Data sources
Bibliographic references
- Date modified: