Body composition of Canadian adults, 2009 to 2011

Archived Content
Information identified as archived is provided for reference, research or recordkeeping purposes. It is not subject to the Government of Canada Web Standards and has not been altered or updated since it was archived. Please "contact us" to request a format other than those available.
![]()
In 2009 to 2011, 67% of Canadian men and 54% of Canadian women aged 18 to 79 were overweight or obese based on results from the Canadian Health Measures Survey.
Body composition is an important indicator of the health of individuals and populations. The body mass index (BMI) is used to identify weight-related health risks by classifying individuals as either underweight, normal weight, overweight or obese.Note 1
Overweight and obesity are associated with an increased risk of numerous health problems including type 2 diabetes, hypertension, obstructive sleep apnea, osteoarthritis, many types of cancer (including breast, colorectal and pancreatic) and cardiovascular disease (coronary heart disease and stroke).Note 1, Note 2 Being underweight is also associated with health problems, including osteoporosis, under-nutrition, infertility and an increased risk of mortality.Note 1, Note 3
Among Canadians aged 18 to 79, almost 2 out of every 3 (60%) adults aged 18 to 79 were overweight or obese while 2% were underweight, based on their measured BMI.
While 40% of Canadian men aged 18 to 79 were overweight and 27% were obese, 32% had a normal BMI (Chart 1). For women, 44% of Canadians aged 18 to 79 had a normal BMI, while 29% were overweight, 25% were obese and 3% were underweight (Chart 2).
Chart 1
Distribution of males aged 18 to 79, by BMI category† and age group, Canada, 2009 to 2011¥
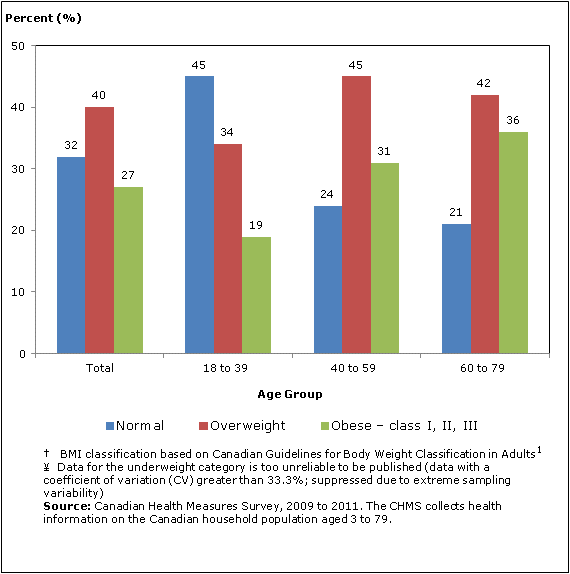
For both adult men and women, those aged 18 to 39 were the most likely to have a normal BMI. Men and women in this age group were also significantly less likely to be overweight or obese than their counterparts aged 40 and over.
Men were significantly more likely to be overweight or obese than women. While approximately 3 out of 10 Canadian men had normal body weight, almost 7 out of 10 were overweight or obese. Among women, more than 4 out of 10 had a normal weight while more than 5 out of 10 were overweight or obese.
Chart 2
Distribution of females aged 18 to 79, by BMI category† and age group, Canada, 2009 to 2011

Waist circumference
As BMI does not provide an indication of fat distribution, waist circumference measurements are used to provide an estimation of abdominal obesity. Abdominal fat can result in increased risk of health problems as excess fat around the waist and upper body is associated with greater health risks than fat located more in the hip and thigh areas.Note 1
Health Canada's health risk classification suggests that a waist circumference of greater than or equal to 102cm for men and greater than or equal to 88cm for women, can lead to an increased risk for developing health problems such as type 2 diabetes, coronary heart disease and hypertension.Note 1
The average waist circumference for Canadian men aged 18 to 79 was 95.1 cm and for women it was 87.3 cm. Among Canadian males, 29% had a waist circumference associated with increased health risks. Canadian women however were significantly more likely to have a waist circumference above the cut-off, with 41% having a waist circumference associated with an increased health risk.
Chart 3
Distribution of household population aged 18 to 79 with increased waist circumference risk,† by sex, Canada, 2009 to 2011

About body mass index
Body mass index (BMI) is the ratio of person's weight in kilograms by their height squared in meters (kg/m2). BMI can be interpreted using the following classification table provide by Health CanadaNote 1:
| BMI (kg/m2) | Classification | Risk of developing health problems |
|---|---|---|
| Less than 18.5 | Underweight | Increased |
| 18.5 to 24.9 | Normal | Least |
| 25.0 to 29.9 | Overweight | Increased |
| 30.0 to 34.9 | Obese, Class I | High |
| 35.0 to 39.9 | Obese, Class II | Very high |
| 40.0 and over | Obese, Class III | Extremely high |
References
- Canadian Guidelines for Body Weight Classification in Adults . Ottawa: Health Canada; 2003.
- Obesity in Canada . Ottawa: Public Health Agency of Canada, Canadian Institute for Health Information; 2011.
- Orpana H, Berthelot JM, Kaplan MS, Feeny DH, McFarland B, Ross NA. BMI and mortality: results from a national longitudinal study of Canadian adults. Obesity. 2010;18(1):214-8.
For more information on the Canadian Health Measures Survey, please contact Statistics Canada's National Contact Centre (toll-free 1-800-263-1136; 613-951-8116; infostats@statcan.gc.ca).
- Date modified: