
Appendix
Daily Charts

Archived Content
Information identified as archived is provided for reference, research or recordkeeping purposes. It is not subject to the Government of Canada Web Standards and has not been altered or updated since it was archived. Please "contact us" to request a format other than those available.
These charts accompany The Daily article released on October 26, 2017.
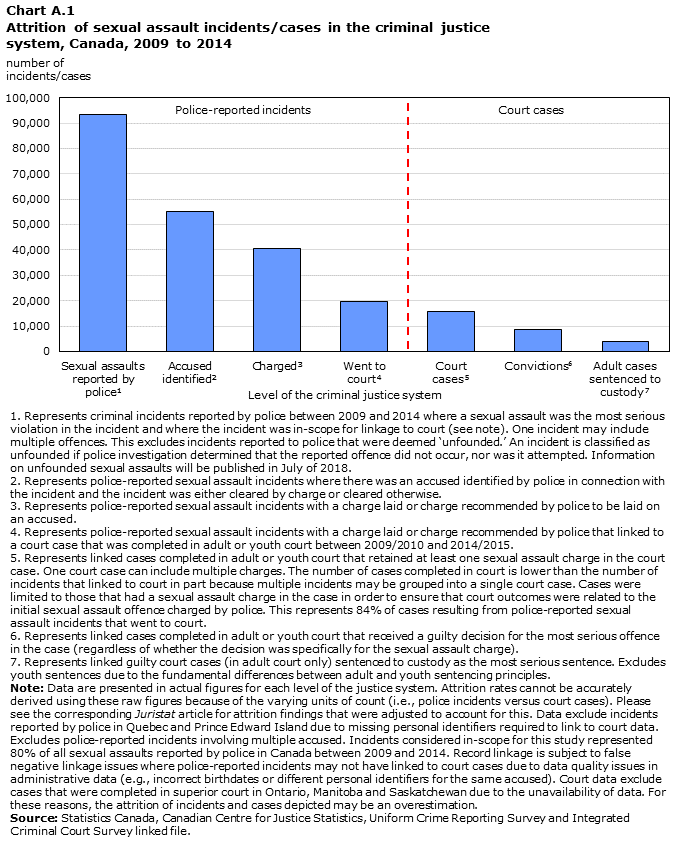
Data table for Chart A.1
| Level of the criminal justice system | Number of incidents/cases |
|---|---|
| Sexual assaults reported by policeData table Note 1 | 93,501 |
| Accused identifiedData table Note 2 | 55,077 |
| ChargedData table Note 3 | 40,490 |
| Went to courtData table Note 4 | 19,806 |
| Court casesData table Note 5 | 15,804 |
| ConvictionsData table Note 6 | 8,742 |
| Adult cases sentenced to custodyData table Note 7 | 3,846 |
Source: Statistics Canada, Canadian Centre for Justice Statistics, Uniform Crime Reporting Survey and Integrated Criminal Court Survey linked file. |
|
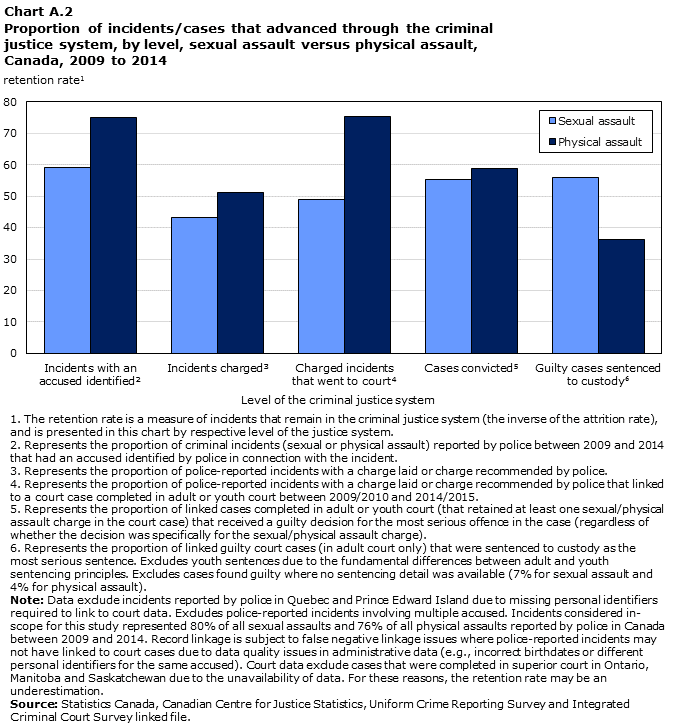
Data table for Chart A.2
| Level of the criminal justice system | Sexual assault | Physical assault |
|---|---|---|
| retention rateData table Note 1 | ||
| Incidents with an accused identifiedData table Note 2 | 59 | 75 |
| Incidents chargedData table Note 3 | 43 | 51 |
| Charged incidents that went to courtData table Note 4 | 49 | 75 |
| Cases convictedData table Note 5 | 55 | 59 |
| Guilty cases sentenced to custodyData table Note 6 | 56 | 36 |
Source: Statistics Canada, Canadian Centre for Justice Statistics, Uniform Crime Reporting Survey and Integrated Criminal Court Survey linked file. |
||
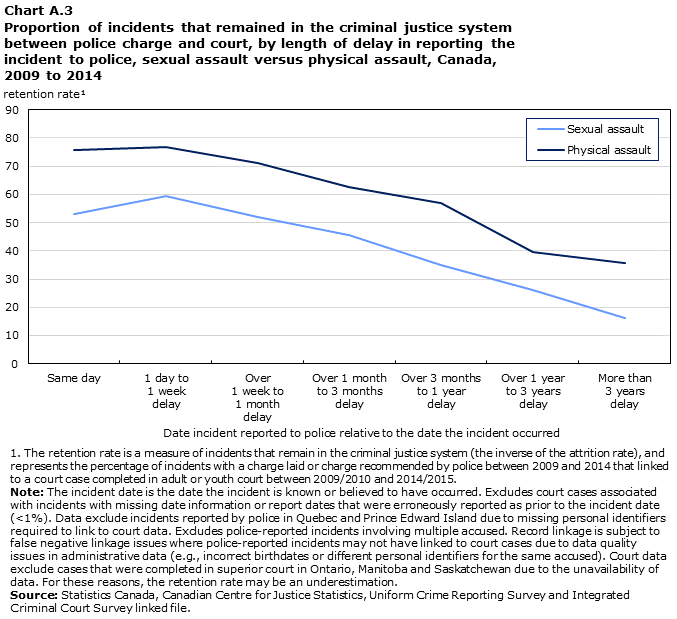
Data table for Chart A.3
| Date incident reported to police relative to the date the incident occurred | Same day | 1 day to 1 week delay | Over 1 week to 1 month delay | Over 1 month to 3 months delay | Over 3 months to 1 year delay | Over 1 year to 3 years delay | More than 3 years delay |
|---|---|---|---|---|---|---|---|
| retention rateData table Note 1 | |||||||
| Sexual assault | 53 | 59 | 52 | 46 | 35 | 26 | 16 |
| Physical assault | 76 | 77 | 71 | 62 | 57 | 40 | 36 |
Source: Statistics Canada, Canadian Centre for Justice Statistics, Uniform Crime Reporting Survey and Integrated Criminal Court Survey linked file. |
|||||||
- Date modified: