
Publications
Spotlight on Canadians: Results from the General Social Survey
Volunteering and charitable giving in Canada
Volunteering and charitable giving in Canada

Archived Content
Information identified as archived is provided for reference, research or recordkeeping purposes. It is not subject to the Government of Canada Web Standards and has not been altered or updated since it was archived. Please "contact us" to request a format other than those available.

By Martin Turcotte
[Highlights][Full article in PDF]
- Volunteering
- Giving to charitable or non-profit organizations
- Volunteering and giving in the provinces
- Summary
- Data sources and definitions
- References
- Notes
Every day, Canadians contribute both their money and time to improve the well-being of their communities. Their financial donations help a variety of causes, such as ensuring shelters, social services organizations and food banks are able to deliver their services, universities and hospitals are able to advance medical research, and political, religious and environmental groups can have their voices heard. Volunteering also has a direct impact on the lives of Canadians, whether it is teaching and supporting children, providing health care, or supporting and giving companionship.
The benefits of volunteering and giving may be even broader for society. Previous research has suggested that volunteerism, by bringing together persons from all walks of life to work on a common project or objective, contributes to “social cohesion” or “social capital” – for example, by increasing social trust, reciprocity and sense of belonging in communities (Wu 2011). At the same time, social capital has been shown to foster more giving and more volunteering in society (Brooks 2005; Brown and Ferris 2007; Wang and Graddy 2008).
Volunteering and giving can also benefit volunteers and donors themselves. For example, volunteers can acquire skills and knowledge, such as management skills, communication or teaching skills, or knowledge of current social or political issues. Some research has even shown that volunteering and giving can contribute to the improved well-being and health of volunteers and donors (Jenkinson, et al., 2013; Dunn, et al., 2008).
This report uses data from the 2013 General Social Survey (GSS) on Giving, Volunteering and Participating to profile volunteering and giving in Canada. The first section presents information about individuals who volunteered in 2013, their characteristics and the number of hours they provided. Changes in both volunteer rates and hours, as well as in the age profile of volunteers, are also discussed. The second section focuses on charitable giving, including changes in donation rates and in the amounts given by Canadians of all ages.
Volunteering
More than 4 in 10 Canadians volunteered in 2013
In 2013, 12.7 million Canadians or 44% of people, aged 15 years and older, participated in some form of volunteer work (Table 1). This represents a decrease from a high of 47% in 2010, the last time the survey was conducted. It also follows a slight increase recorded between 2004 and 2010.
| 2013 | 2010 | 2007 | 2004 | |
|---|---|---|---|---|
| Volunteer rate | ||||
| Total population (thousands) | 29,188 | 28,206Note † | 27,000Note † | 26,021Note † |
| Number of volunteers (thousands) | 12,716 | 13,249Note † | 12,444 | 11,773Note † |
| Volunteer rate (percentage) | 44 | 47Note † | 46Note † | 45Note † |
| Volunteer hours | ||||
| Total annual volunteer hours (millions) | 1,957 | 2,063 | 2,062 | 1,978 |
| Average annual volunteer hours (hours) | 154 | 156 | 166 | 168Note † |
|
||||
The total number of volunteers was lower in 2013 than in 2010 (12.7 and 13.2 million, respectively). This translates into a 4.0% decline in the total number of Canadian volunteers, despite the fact that the population aged 15 years and older increased by about one million during the same period (+3.5 %).
Along with participation in volunteer activities, information was collected on the total number of volunteer hours. In 2013, volunteers devoted about 1.96 billion hours to their volunteer activities, a volume of work that is equivalent to about 1 million full-time jobs.
Volunteers contributed 154 hours on average in 2013, unchanged from 2010, but lower than the 168 hours recorded in 2004.
Younger people most likely to volunteer
Many factors are associated with volunteering, including early life and youth experiences, type and size of a person’s social network, marital status, socio-economic characteristics and even personality type. In this initial analysis of the GSS on Giving, Volunteering and Participating, variations by sex, age and highest level of education are examined.
In 2013, women were slightly more likely to volunteer than men (45% versus 42%) (Table 2). This differs from 2010 and 2007, where women and men did not vary in their tendency to volunteer.
| Volunteer rate | ||||
|---|---|---|---|---|
| 2013 | 2010 | 2007 | 2004 | |
| percentage | ||||
| Total | 44 | 47Note † | 46Note † | 45Note † |
| Men (ref.) | 42 | 46Note † | 45Note † | 44 |
| Women | 45Note * | 48Note † | 47Note † | 47Note *Note † |
| Age | ||||
| 15 to 19 | 66Note * | 66Note * | 65Note * | 65Note * |
| 20 to 24 | 42 | 48Note * | 47Note * | 43Note * |
| 25 to 34 | 42Note * | 46Note * | 40Note * | 42Note * |
| 35 to 44 (ref.) | 48 | 54Note † | 52Note † | 51 |
| 45 to 54 | 45 | 45Note * | 48Note * | 47Note * |
| 55 to 64 | 41Note * | 41Note * | 40Note * | 42Note * |
| 65 to 74 | 38Note * | 40Note * | 40Note * | 39Note * |
| 75 and over | 27Note * | 31Note * | 29Note * | 23Note *Note † |
|
||||
A much stronger correlation existed between age and volunteerism. In 2013, older seniors aged 75 and over were the least likely to volunteer (27%), followed by those aged 65 to 74 (38%). Younger people aged 15 to 19 were, by far, the most likely to do some volunteer work, as two thirds of them did so (66%, unchanged from 2010).
This proportion may, however, be influenced by “mandatory” volunteering. Many students are required to perform community service to fulfill the course requirements needed to graduate from high school. One in five volunteers aged 15 to 19 reported that they were required to volunteer (20%). This compares to 7% of people aged 20 years and over.
After adolescents and young adults aged 15 to 19, middle-aged adults, who are often parents of school-aged children, were the most likely to do volunteer work. In particular, 48% of people aged 35 to 44 volunteered in 2013, higher than the average of 44%.Note 1
Decline in the volunteer rate most pronounced among persons aged 35 to 44
In terms of trends over time, the volunteer rate did not change in the same way among all age groups. Among people aged 35 to 44, the share of people who volunteered decreased by 6 percentage points from 2010 to 2013 (from 54% to 48%).
The story was different for older Canadians, as the proportion who volunteered was virtually unchanged between 2010 and 2013. For example, 41% of people aged 55 to 64 volunteered their time in 2013, the same proportion as in 2010.
Older volunteers less likely to volunteer but contributed the most hours
As in the previous years, younger seniors who volunteered contributed the highest average annual hours in 2013. In particular, volunteers aged 65 to 74 spent about 231 hours volunteering, almost double the number of hours (122 hours) recorded for those aged 35 to 44 (Table 3).
| Average annual volunteer hours | ||||
|---|---|---|---|---|
| 2013 | 2010 | 2007 | 2004 | |
| hours | ||||
| Total | 154 | 156 | 166 | 168Note † |
| Men (ref.) | 164 | 153 | 168 | 168 |
| Women | 145 | 158 | 164Note † | 168Note † |
| Age | ||||
| 15 to 19 | 110 | 115 | 116Note * | 127Note * |
| 20 to 24 | 147 | 159Note E: Use with caution | 182 | 161 |
| 25 to 34 | 126 | 109 | 133 | 137 |
| 35 to 44 (ref.) | 122 | 136 | 158Note † | 152Note † |
| 45 to 54 | 150Note * | 168Note * | 169 | 176Note *Note † |
| 55 to 64 | 203Note * | 201Note * | 206Note * | 202Note * |
| 65 to 74 | 231Note * | 236Note * | 216Note * | 250Note * |
| 75 and over | 196Note * | 198Note * | 222Note * | 234Note * |
E use with caution
|
||||
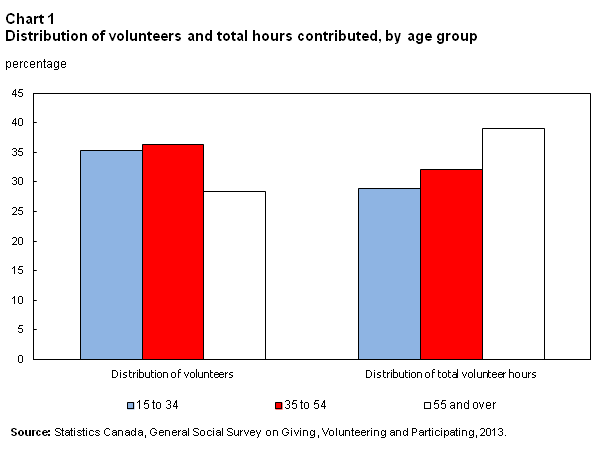
Overall, volunteers aged 55 and over contributed 39% of the 1.96 billion hours volunteered by Canadians aged 15 and over in 2013. This proportion was higher than their share of the total population of volunteers (28%) (Chart 1).
Changing profile of the volunteer population: older and more educated
Just like the general population, the population of volunteers is aging (Chart 2). In 2013, 28% of all Canadian volunteers were aged 55 and older, compared to 23% in 2004. In contrast, the share of volunteers aged 35 to 44 decreased from 22% in 2004 to 18% in 2013.
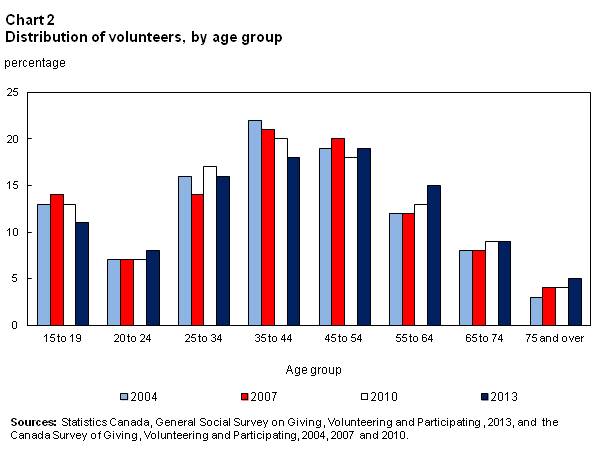
The proportion of volunteers aged 55 and over increased during this period, and their contribution to the total number of hours volunteered increased as well. Precisely, the percentage of all volunteer hours contributed by people aged 55 and over rose by 8 percentage points between 2004 and 2013. In contrast, the percentage of all volunteer hours contributed by people aged 35 to 54 decreased by 8 percentage points.
These population aging trends were also evident in the age profile of “top volunteers”, defined here as the 25% of volunteers who contributed the most hours over the previous yearNote 2. In 2013, older Canadians aged 55 and over represented 38% of these top volunteers, up from 31% in 2004 (Table 4). In summary, older Canadians’ overrepresentation in the share of volunteers and in the number of volunteer hours is rising.
| Distribution of top volunteersNote 1 | ||||
|---|---|---|---|---|
| 2013 | 2010 | 2007 | 2004 | |
| percentage | ||||
| Total | 100 | 100 | 100 | 100 |
| Men | 51 | 48 | 49 | 48 |
| Women | 49 | 52 | 51 | 52 |
| Age | ||||
| 15 to 34 | 28 | 29 | 27 | 29 |
| 35 to 54 | 34 | 37 | 41Note † | 40Note † |
| 55 and over | 38 | 34 | 32Note † | 31Note † |
|
||||
This changing age profile of volunteers could have several implications for the voluntary sector and for organizations in need of volunteers. This is because, among other things, older volunteers are more likely to do certain types of activities. For example, in 2013, 42% sat on a committee or board, compared to 34% of volunteers aged 35 to 54 and 26% of volunteers aged 15 to 34.
Older volunteers are also more likely to provide health care or support, such as companionship, through an organization: 20% of volunteers aged 55 and over provided that type of care, compared to 15% of volunteers aged 35 to 54. On the other hand, older volunteers are less likely to teach, educate or mentor, or to coach, referee or officiate.
Volunteers are becoming more and more educated
Also mirroring the overall population, volunteers are becoming more and more educated. From 2004 to 2013, the percentage of volunteers aged 25 to 64 with a university degree rose by 4 percentage points to 39% (Chart 3).
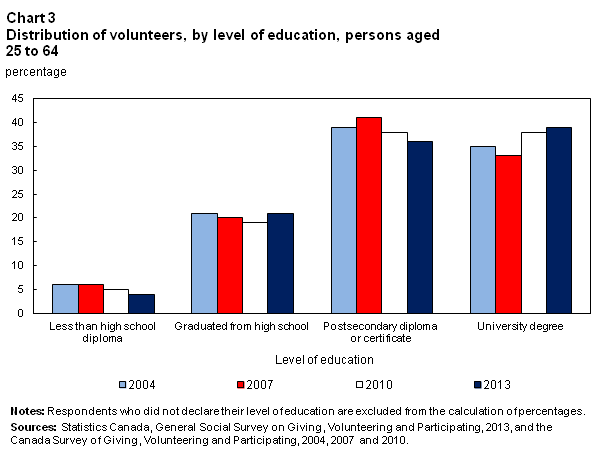
A more educated population and more volunteers with post-secondary credentials may also affect the pool of skills available for non-profit organizations. For example among people aged 25 to 64, university graduate volunteers were more likely to teach, educate and mentor (36%) than those with lower levels of educational attainment (27% of those who completed a college or trade certificate or diploma, and 21% of volunteers with a high school degree). They were also more likely to sit as members of a committee or board (41%, compared to 30% of those without a university degree).
Conversely, volunteers aged 25 to 64 with a university degree were less likely to perform volunteer work associated with the maintenance, repair or building of facilities or grounds (13%, compared to 19 % of those who did not complete a university degree).
Giving to charitable or non-profit organizations
Proportionally fewer Canadians were donors but they donated more
For many people, especially those with busy lives, giving money to charitable or non-profit organizations may be less demanding and less time-consuming than volunteering their time. Giving money to a cause or to an organization may also be the preferred option when volunteering represents a challenge, such as with older seniors whose health condition may be more fragile.
For these reasons and many others, the donor rate is typically substantially higher than the volunteer rate. Indeed in 2013, the vast majority of Canadians (82%) made financial donations to a charitable or non-profit organization.
While the proportion of people aged 15 and over who made a financial donation was down by two percentage points from 2010, the trend in the donation amount followed an opposite direction. Between 2010 and 2013, the total amount donated by Canadians to charitable or non-profit organizations increased by 14% to $12.8 billion (all figures in this section are presented in 2013 dollars) (Table 5).
| 2013 | 2010 | 2007 | 2004 | |
|---|---|---|---|---|
| Donor rate | ||||
| Total population (thousands) | 29,188 | 28,206Note † | 27,000Note † | 26,021Note † |
| Total number of donors (thousands) | 24,051 | 23,736 | 22,793Note † | 22,140Note † |
| Donor rate (percentage) | 82 | 84Note † | 84Note † | 85Note † |
| Amount of donations | ||||
| Total amount (thousand of dollars) | 12,763,566 | 11,158,712Note † | 10,965,873Note † | 10,392,187Note † |
| Average annual amount per donors | 531 | 470Note † | 481 | 469Note † |
| Amount of donations by type of organization | ||||
| Total amount donated to religious organizations (thousands of dollars) | 5,227,931 | 4,481,629Note † | 5,050,201 | 4,637,337 |
| Total amount donated to non-religious organizations (thousands of dollars) | 7,535,634 | 6,677,084Note † | 5,915,672Note † | 5,754,850Note † |
Sources: Statistics Canada, General Social Survey on Giving, Volunteering and Participating, 2013, and the Canada Survey of Giving, Volunteering and Participating, 2004, 2007 and 2010. |
||||
This growth in the total amount of financial donations was also reflected in the average amounts donated by individual donors. In 2013, the average annual amount per donor was $531, up $61 from 2010.
Donors aged 55 and over gave the most
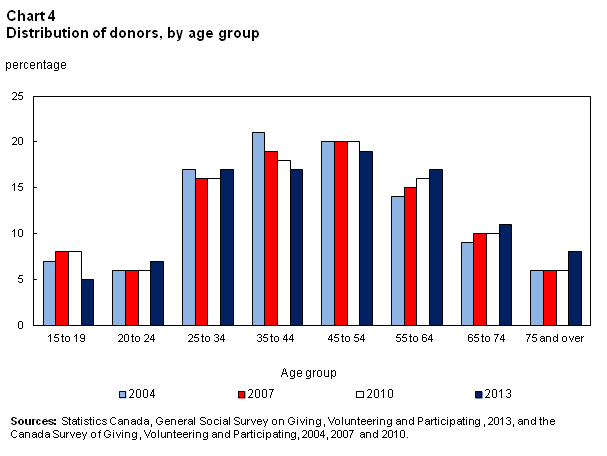
Mirroring the typical volunteer and the typical Canadian, the average donor is getting older (Chart 4). In 2013, 35% of all donors were aged 55 and over, up from 29% in 2004.
Older Canadians were more likely to donate to religious organizations, health organizations and hospitals than younger Canadians. On the other hand, they were proportionally less likely to contribute to educational organizations. What may distinguish them the most from other Canadians, however, is the average amount of money they gave.
In 2013, donors aged 75 and over gave an average of $726 to non-profit or charitable organizations, about $300 more than donors aged 35 to 44 (Table 6).
| Average annual donation | ||||
|---|---|---|---|---|
| 2013 | 2010 | 2007 | 2004 | |
| dollars | ||||
| Total | 531 | 470Note † | 481 | 469Note † |
| Men (ref.) | 580 | 491Note † | 499Note † | 504 |
| Women | 484Note * | 451 | 465 | 438Note * |
| Age | ||||
| 15 to 19 | 156Note *Note E: Use with caution | 136Note * | 125Note * | 102Note * |
| 20 to 24 | 245Note *Note E: Use with caution | 169Note *Note E: Use with caution | 193Note * | 208Note * |
| 25 to 34 | 364 | 322Note * | 351Note * | 364Note * |
| 35 to 44 (ref.) | 427 | 454 | 488 | 434 |
| 45 to 54 | 664Note * | 502Note † | 601Note * | 580Note * |
| 55 to 64 | 681Note * | 660Note * | 548Note † | 586Note * |
| 65 to 74 | 715Note * | 625Note * | 634Note * | 616Note *Note † |
| 75 and over | 726Note * | 765Note * | 736Note * | 758Note * |
E use with caution
|
||||
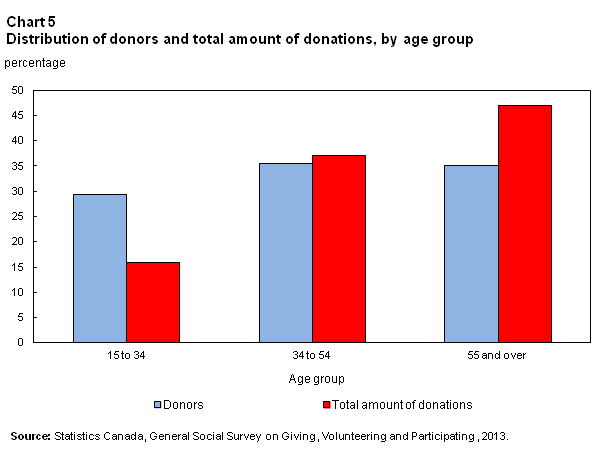
In 2013, older Canadians aged 55 and older accounted for 34% of the total population aged 15 and over and 35% of donors. However, they contributed 47% of all donations made during the year (Chart 5). In addition, the proportion of the total amount of charitable donations contributed by older Canadians has increased since 2004, from 39% to 47% in 2013.
Four-fifths of financial donations made by 25% of donors
All donors are important to charitable and non-profit organizations. However, the “top donors,” defined as the 25% of donors who contributed the most money, contribute to about four fifths of the total annual amount of donations in a given year. The role of these top donors was even more pronounced in the most recent period. In 2013, they contributed 84% of all donations, up from 82% in 2004.
The relative importance of the 10% of donors who give the highest dollar amounts increased even more. In fact, most of the increase in total donations to charitable and non-profit organization was due to the increased contribution of the 10% of donors who gave the most.
In 2013, these donors gave a total of $8.4 billion, which corresponded to 66% of all donations made during that year. In comparison, in 2010, the 10% of donors who gave the most contributed $7 billion (63% of total donations) (Chart 6).
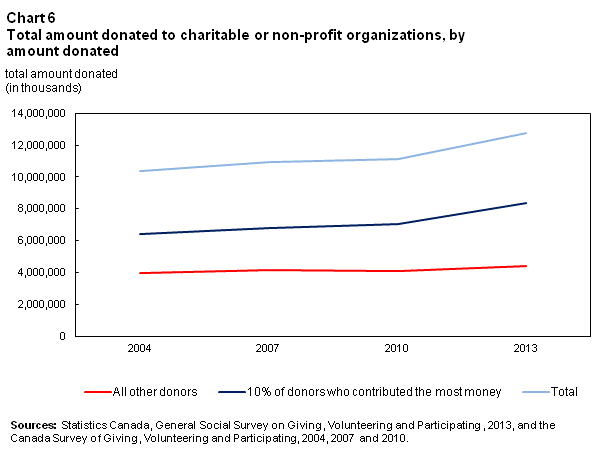
Together, all other donors contributed about $4.4 billion in 2013, an amount that was virtually unchanged from previous years.
Slightly more than 40% of all financial donations went to religious organizations
Information was collected on the type of organizations benefiting from charitable donations. In 2013, donations made to religious organizations represented $5.2 billion, or 41% of all dollars given in that yearNote 3. This proportion was similar to the one recorded in 2010, but lower than in 2007 (46%) and in 2004 (45%).
Among non-religious organizations, organizations in the health sector and social services organizations ranked second and third in terms of amount collected from individual donors. More precisely, health organizations received $1.7 billion (13% of all donations) and those in social services $1.6 billion (12% of all donations).
Women contributed 53% of all donations to religious organizations
Previous research has found that Canadians who give the most to religious organizations include those who attend a religious service weekly, those who volunteer more hours, immigrants and older seniors (Turcotte, 2012; Thomas, 2012). The same general conclusions applied in 2013.
For example, Canadians who attended a religious service weekly gave on average $899 to religious organizations, compared to $67 for those who did not attend weekly.
In 2013, women and men gave about the same average annual amount to religious organizations (about $220 a year). However, since women were more likely to make a donation, they contributed 53% of the total donations made to religious organizations (Table 7).
| Donations to religious organizations | Donations to non-religious organizations | |
|---|---|---|
| thousands of dollars | ||
| Total | 5,227,931 | 7,535,634 |
| percentage distribution | ||
| Total | 100 | 100 |
| Men | 47 | 56 |
| Women | 53 | 44 |
| Age | ||
| 15 to 34 | 17 | 16 |
| 34 to 54 | 33 | 40 |
| 55 and over | 50 | 44 |
| Top donorsNote 1 | ||
| No | 7 | 21 |
| Yes | 93 | 79 |
|
||
In contrast, men gave more than women to non-religious organizations ($366 compared to $264 for women). Overall, 56% of all donations to non-religious organizations were made by men.
Older Canadians contribute more to charitable and non-profit organizations than their percentage of the population. That is even more the case for giving to religious organizations. In 2013, 50% of all donations made to religious organizations were made by persons aged 55 and over. In comparison, Canadians aged 55 and older contributed 44% of all donations to non-religious organizations.
Finally, top donors, or the 25% of donors who gave the most, were especially important for religious organizations. In 2013, they contributed 93% of all donations to religious organizations. In comparison, they contributed 79% of all donations to non-religious organizations.
Volunteering and giving in the provinces
Start of text box
The rate of volunteering and donating varies across Canada. In 2013, the volunteer rate was highest in Saskatchewan (56%) and Manitoba (52%). Both were significantly higher than the national average of 44%. In contrast, the rate of volunteering was lowest in Québec, where about one-third (32%) of the population aged 15 and over volunteered for an organization. Quebec was also the only province with an average number of volunteer hours below the national average (Table A.1).
| Volunteer rate | Average annual volunteer hours | |||||||
|---|---|---|---|---|---|---|---|---|
| 2013 | 2010 | 2007 | 2004 | 2013 | 2010 | 2007 | 2004 | |
| percentage | hours | |||||||
| Canada (ref.) | 44 | 47Note † | 46Note † | 45Note † | 154 | 156 | 166 | 168Note † |
| Newfoundland and Labrador | 46 | 52Note *Note † | 46 | 42Note * | 151 | 155 | 176 | 188 |
| Prince Edward Island | 50Note * | 56Note * | 56Note * | 47 | 179 | 157 | 147 | 163 |
| Nova Scotia | 51Note * | 54Note * | 55Note *Note † | 48Note * | 181 | 207Note * | 183 | 195Note * |
| New Brunswick | 41 | 49Note † | 48Note † | 44 | 180 | 154 | 175 | 185 |
| Quebec | 32Note * | 37Note *Note † | 37Note *Note † | 34Note * | 123Note * | 128Note * | 162Note † | 146Note *Note † |
| Ontario | 44 | 48Note † | 47Note *Note † | 50Note *Note † | 166 | 164 | 164 | 162 |
| Manitoba | 52Note * | 53Note * | 54Note * | 50Note * | 155 | 141 | 159 | 155 |
| Saskatchewan | 56Note * | 58Note * | 59Note * | 54Note * | 139 | 143 | 147 | 188Note † |
| Alberta | 50Note * | 55Note * | 52Note * | 48Note * | 161 | 140 | 172 | 175 |
| British Columbia | 49Note * | 50Note * | 47 | 45Note † | 145 | 178Note *Note † | 172Note † | 199Note *Note † |
|
||||||||
While the volunteer rate grew in almost all provinces between 2004 and 2010, this trend recently reversed in many of them. For 4 of the provinces in 2013, the share of the population aged 15 and over who volunteered was lower compared to 2010.
Precisely, the rate of volunteering fell from 52% to 46% in Newfoundland and Labrador. Similar declines were observed in New Brunswick (49% to 41%), Quebec (37% to 32%) and Ontario (48% to 44%).
West of Ontario, the changes between 2010 and 2013 were either more modest or not statistically significant.
Highest donor rate in Newfoundland and Labrador
The proportion of Canadians making a financial donation in the last year ranged from a high of 87% in Newfoundland and Labrador to a low of 78% in British Columbia. The amount of donations also differed throughout the country, with donors in Alberta ($863), British Columbia ($704) and Manitoba ($699) reporting higher than average financial donations in 2013. Conversely, average donations were lowest in Quebec ($264) and New Brunswick ($345) (Table A.2).
| Donor rate | Average annual donation | |||||||
|---|---|---|---|---|---|---|---|---|
| 2013 | 2010 | 2007 | 2004 | 2013 | 2010 | 2007 | 2004 | |
| percentage | amount | |||||||
| Canada (ref.) | 82 | 84Note † | 84Note † | 85Note † | 531 | 470Note † | 481 | 469Note † |
| Newfoundland and Labrador | 87Note * | 92Note *Note † | 91Note * | 93Note *Note † | 350Note * | 349Note * | 330Note * | 349Note * |
| Prince Edward Island | 84 | 91Note *Note † | 89Note *Note † | 93Note *Note † | 497 | 504 | 494 | 459 |
| Nova Scotia | 84 | 88Note *Note † | 87 | 90Note *Note † | 396Note * | 389Note * | 452 | 444 |
| New Brunswick | 83 | 88Note *Note † | 88Note *Note † | 88Note *Note † | 345Note * | 400 | 409Note * | 412 |
| Quebec | 81 | 85Note † | 84Note † | 83Note * | 264Note * | 219Note * | 241Note * | 207Note * |
| Ontario | 83 | 84 | 86Note * | 90Note *Note † | 532 | 554Note * | 551Note * | 573Note * |
| Manitoba | 84 | 86 | 87 | 84 | 699Note * | 547 | 572Note * | 533 |
| Saskatchewan | 85 | 84 | 84 | 82Note * | 680Note * | 573Note * | 564 | 506Note † |
| Alberta | 85 | 84 | 85 | 79Note *Note † | 863Note * | 593Note *Note † | 656Note *Note † | 586Note *Note † |
| British Columbia | 78Note * | 80Note * | 79Note * | 77Note * | 704Note * | 573Note * | 557Note * | 547Note *Note † |
|
||||||||
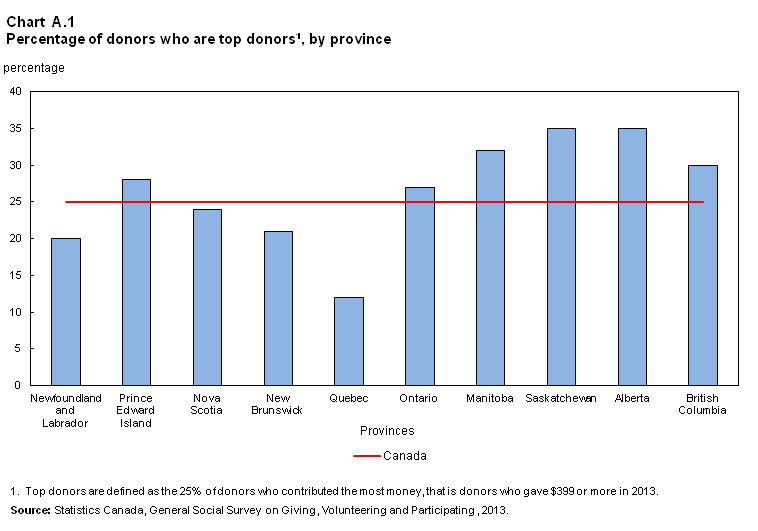
Top donors can be defined as the 25% of donors who contributed the most money during the year. The share of top donors also varied regionally, from a low of 12% in Quebec to a high of 35% in Alberta (Chart A.1).
End of text box.
Summary
This report presents the initial findings from the General Social Survey on Giving, Volunteering and Participating. In 2013, both the number and the proportion of volunteers were lower than in 2010. A decrease was also recorded in the proportion of donors.
That said, the average and the total number of volunteer hours were virtually unchanged from 2010. Also, the total amount given to non-profit or charitable organizations increased between 2010 and 2013. Overall, Canadians gave $12.8 billion to charitable or non-profit organizations. On average, donors gave $531 a year, compared to $470 in 2010.
Both volunteers and donors are getting older and more educated: more and more volunteer hours are contributed by seniors and older Canadians, and a greater proportion of all donations come from that demographic group. This changing profile could have many consequences for the voluntary and philanthropy sector in terms of the type of volunteer activities, the types of organizations benefiting from volunteerism and charitable giving, and the dollar amount of monetary contributions.
This article has provided a general overview of volunteering and charitable giving patterns in 2013. Forthcoming reports will provide more in-depth analysis on both volunteering and charitable giving.
Data sources and definitions
This release provides data from the 2013 General Social Survey on Giving, Volunteering and Participating (GVP). It is the sixth iteration of a series of surveys that began with the National Survey of Giving, Volunteering and Participating (NSGVP) in 1997. The survey was last conducted in 2010.
The 2013 GSS GVP continues the method of measuring giving, volunteering and participating established by the 2004, 2007 and 2010 Canada Survey of Giving, Volunteering and Participating (CSGVP). CSGVP replaced the way these behaviours were measured in the 1997 and 2000 NSGVP. For this reason, it is not appropriate to compare results from the 2013 GSS GVP or the 2010, 2007, or 2004 CSGVP with previous NSGVP estimates. For more details, see Summary of changes over time – General Social Survey – Giving, Volunteering and Participating (GVP).
This survey is the result of a partnership of federal government departments and voluntary sector organizations that includes Canadian Heritage, Employment and Social Development Canada, Health Canada, the Public Health Agency of Canada, Canada Revenue Agency, Statistics Canada, Imagine Canada, and Volunteer Canada.
Volunteers
In this report, volunteers are people who have provided a service, without monetary compensation, for a group or organization at least once during the 12 months preceding the survey. This includes any unpaid help provided to schools, religious organizations, sports or community associations.
In order to identify volunteers in the General Survey on Giving, Volunteering and Participating, respondents were asked the following questions, including a preamble:
“Now, I’d like to ask you some questions about any activities that you did without pay on behalf of a group or an organization in the past 12 months.
This includes any unpaid help you provided to schools, religious organizations, sports or community associations.
Did you do any 1) canvassing; 2) fundraising; 3) Did you sit as a member of a committee or board; 4) Did you do any teaching, educating or mentoring; 5) Did you organize, supervise or coordinate activities or events; 6) Did you do any office work, bookkeeping, administrative duties, or library work; 7) Did you coach, referee or officiate; 8) counsel or provide advice; 9) provide health care or support including companionship; 10) collect, serve or deliver food or other goods; 11) Did you do any work associated with the maintenance, repair or building of facilities or grounds; 12) volunteer driving; 13) provide help through first aid, fire-fighting, or search and rescue; 14) engage in activities aimed at conservation or protection of the environment or wildlife; 15) In the past 12 months, did you do any other unpaid activities on behalf of a group or an organization?”.
Respondents who reported that they did any one of these activities were considered as volunteers.
Donors
Donors are defined as those who have made at least one monetary donation to a charity or non-profit during the 12 months preceding the survey. This definition excludes donations of food, clothing and household goods. Donations from public and private companies and non-profit organizations and corporations are not included in the data. For those who are married or in a common-law union, the financial donations may include those made jointly with a spouse or partner.
More specifically, respondents are asked: “In the past 12 months, did you make a charitable donation: 1) by responding to a request through the mail?; 2) by responding to a telephone request?; 3) by responding to a television or radio request, or a telethon?; 4) online?; 5) by approaching a charitable or non–profit organization on your own?; 6) by paying to attend a charity event?; 7) by donating in the name of someone who has passed away, or ’in memoriam’?; 8) when asked by someone at work?; 9) when asked by someone doing door-to-door canvassing?; 10) when asked by someone canvassing for a charitable organization at a shopping centre or on the street?; 11) through a collection at a church, synagogue, mosque or other place of worship?; 12) by sponsoring someone in an event such as a walk-a-thon?; 13) In the past 12 months, were there any other methods in which you gave money to a charitable or non–profit organization?”.
Respondents who said yes to any of these questions were considered as donors.
References
Brooks, Arthur C. 2005. “Does Social Capital Make you Generous?” Social Science Quarterly vol. 86, no.1.
Brown, Eleanor and James M.Ferris. 2007. “Social Capital and Philanthropy: An Analysis of the Impact of Social Capital on Individual Giving and Volunteering” Nonprofit and Voluntary Sector Quarterly, vol.36.
Dunn, Elizabeth W., Lara B. Aknin and Michael I. Norton. 2008. “Spending Money on Others Promotes Happiness” Science, vol.319, no.5870, March 2008.
Jenkinson, Caroline E. , Andy P. Dickens, Kerry Jones, Jo Thompson-Coon, Rod S. Taylor, Morwenna Rogers, Clare L. Bambra, Iain Lang and Suzanne H. Richards. 2013. “Is volunteering a public health intervention? A systematic review and meta-analysis of the health and survival of volunteers”, BMC Public Health, vo.13.
Thomas, Derrick. 2012. “Giving and volunteering among Canada’s immigrants” Canadian Social Trends, Statistics Canada Catalogue no. 11-008.
Turcotte, Martin. 2012. “Charitable giving by Canadians” Canadian Social Trends, Statistics Canada Catalogue no. 11-008.
Vézina, Mireille and Suzan Crompton. 2012. “Volunteering in Canada” Canadian Social Trends, Statistics Canada Catalogue no. 11-008.
Wang, Lili and Elizabeth Graddy. 2008. “Social Capital, Volunteering, and Charitable Giving” Voluntas, vol.19.
Wu, Huiting. 2011. Social Impact of Volunteerism. Points of Light Institute.
Notes
- Date modified: