
Farm and Farm Operator Data
Blueberries: A bright spot for New Brunswick agriculture

Archived Content
Information identified as archived is provided for reference, research or recordkeeping purposes. It is not subject to the Government of Canada Web Standards and has not been altered or updated since it was archived. Please "contact us" to request a format other than those available.
There were considerably fewer farms and farm operators in New Brunswick in 2016 from five years earlier and the province also reported the largest percentage decrease in total farm area in Canada.
However, the farm operators that remained saw a slight improvement in the expense-to receipt ratio from 2011.
The total area of land dedicated to fruits, berries and nuts in New Brunswick rose by over half from 2011—the largest percentage and acreage increase in Canada. Most of this gain was attributable to blueberries.
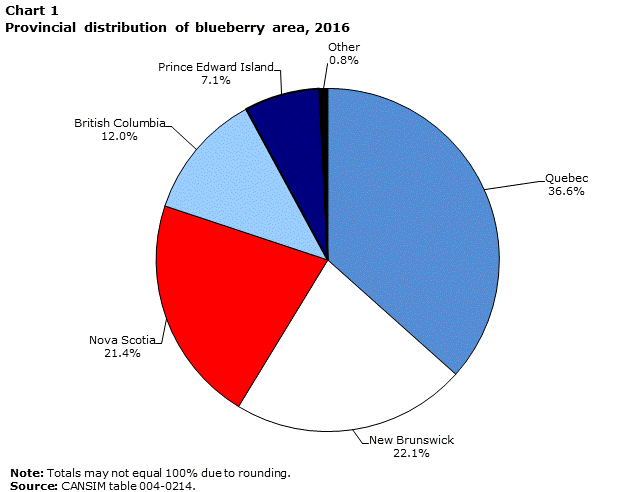
Data table for Chart 1
| Province | Percent |
|---|---|
| Quebec | 36.6 |
| New Brunswick | 22.1 |
| Nova Scotia | 21.4 |
| British Columbia | 12.0 |
| Prince Edward Island | 7.1 |
| Other | 0.8 |
|
Note: Totals may not equal 100% due to rounding. Source: CANSIM table 004-0214. |
|
Potatoes, oats and barley remained the three largest field crops in New Brunswick, but area seeded to potatoes and barley was down from 2011.
The number of dairy cows edged down from 2011 but milk production was up as a result of increased production per animal.
New Brunswick reported the largest drop in the number of pigs in Canada from 2011 to 2016, but the remaining pig type farms in the province saw the biggest improvement in the expense-to-receipt ratio from 2011.
Primary agriculture represented 0.8% of provincial gross domestic product (agricultural GDP) in 2013. This percentage increased to 4.9% when agricultural input and service providers, primary producers, food and beverage processors, and food retailers and wholesalers industries are also taken into account (Statistics Canada. 2013. Special tabulation, based on 2013 gross domestic product by industry – provincial and territorial).
Agricultural operations in New Brunswick employed 6,262 people in 2015.
New Brunswick reports the second largest percent decline in farm numbers
The 2016 Census of Agriculture counted 2,255 census farms in New Brunswick, down 13.6% from 2011, which was the second largest percentage decline nationally. In 2016, the total number of farms in Canada declined 5.9% from five years earlier.
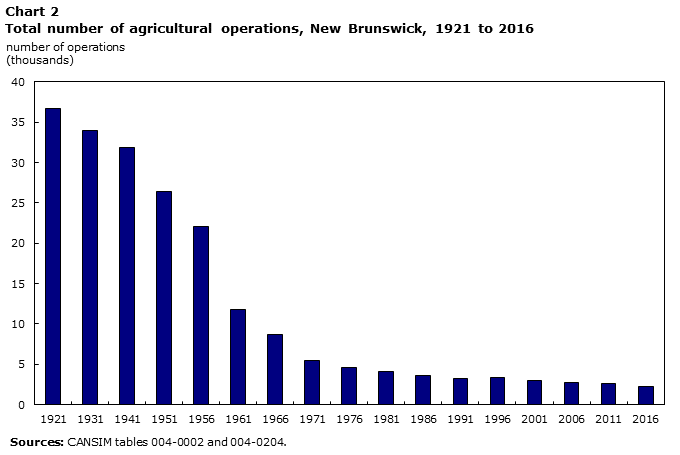
Data table for Chart 2
| Year | Number of operations (thousands) |
|---|---|
| 1921 | 36,655 |
| 1931 | 34,025 |
| 1941 | 31,889 |
| 1951 | 26,431 |
| 1956 | 22,116 |
| 1961 | 11,786 |
| 1966 | 8,706 |
| 1971 | 5,485 |
| 1976 | 4,551 |
| 1981 | 4,063 |
| 1986 | 3,554 |
| 1991 | 3,252 |
| 1996 | 3,405 |
| 2001 | 3,034 |
| 2006 | 2,776 |
| 2011 | 2,611 |
| 2016 | 2,255 |
| Sources: CANSIM tables 004-0002 and 004-0204. | |
Blueberries drive the increase in fruits, berries and nuts area
The total area of land in fruits, berries and nuts increased 52.4% from 2011 to 45,480 acres in 2016. This was the largest increase both proportionally and in acreage in Canada. The gain was largely attributable to blueberries (55.6%), which accounted for 95.4% of total fruits, berries and nuts area. New Brunswick had the second largest area devoted to fruits, berries and nuts in the Atlantic provinces. Blueberries (43,369 acres) were the leading fruits, berries and nuts commodity in area, followed by cranberries (875 acres) and apples (553 acres).
Gross farm receipts for fruit and tree nut type farms in New Brunswick increased 38.9% from 2011 (in 2015 constant dollars)—the largest percentage increase in gross farm receipts for that farm type in Canada.
Field vegetable area declined 10.6% from 2011 to 1,719 acres in 2016. The leading field vegetables in 2016 were sweet corn (305 acres), squash and zucchini (232 acres) and pumpkin (212 acres).
The area dedicated to greenhouse flower and vegetable production declined 11.8% to 1.4 million square feet. Most of this area was dedicated to flowers.
New Brunswick remains second in maple tap numbers
The number of maple taps in New Brunswick rose 20.5% to 2.3 million taps in 2016 — the largest increase proportionally in Canada. Moreover, the province continues to have the second largest number of reported maple taps, accounting for 4.9% of Canada’s total maple tap numbers.
Favourable weather conditions during the 2016 maple syrup season resulted in greater production not only in New Brunswick but across Canada (CANSIM table 001-0008, accessed April 21, 2017).
New Brunswick reports fewer but larger farms
The total farm area over which farmers had stewardship in New Brunswick declined 10.9% from 2011 to 835,329 acres in 2016—the largest percentage decrease in Canada. Meanwhile, the area of cropland in New Brunswick edged down 1.9% to 344,504 acres.
Start of text box
Total farm area, which is land owned or operated by an agricultural operation, includes:
- cropland;
- summerfallow;
- improved and unimproved pasture;
- woodlands and wetlands;
- all other land (including idle land, and land on which farm buildings are located).
End of text box
Although the total farm area fell, the average farm size grew from 359 acres in 2011 to 370 acres in 2016. This five-year period saw shifts of area away from field crops and hay to production of fruits, berries and nuts.
| Component of cropland | 2011 | 2016 |
|---|---|---|
| Percent of croplandTable 1 Note 1 | ||
| Field crops | 40.8 | 39.2 |
| Hay | 49.7 | 46.6 |
| Vegetables | 0.5 | 0.5 |
| Fruits, berries and nuts | 8.5 | 13.2 |
| Sod and Nursery | 0.4 | 0.4 |
| Total cropland | 100.0 | 100.0 |
|
||
Potatoes are the leading crop in New Brunswick
The leading field crops in New Brunswick in 2016 were potatoes, oats and barley. This ranking was unchanged from the 2011 Census. New Brunswick ranked eighth provincially in terms of field crop area.
Crop rotations offer environmental and agronomic benefits including boosting biodiversity and breaking pest cycles while also increasing nutrient utilization. This practice improves capital and labour utilization by staggering planting and harvest windows, and helps to manage business risk by varying products and hedges against commodity-specific environmental and disease pressures.
| Field crop | 2011 | 2016 |
|---|---|---|
| Acreage | ||
| Potatoes | 51,814 | 46,240 |
| Oats | 23,324 | 25,299 |
| Barley | 23,144 | 17,057 |
| Source: CANSIM table 004-0213. | ||
Other crop type farms accounted for 22.9% of the farms in New Brunswick in 2016, while fruit and tree nut type farms accounted for 18.4%. Other crop type farms include farms reporting potatoes and maple taps, both of which have a large presence in New Brunswick. Fruit and tree nut farm types are the second largest due to the presence of blueberries in the province.
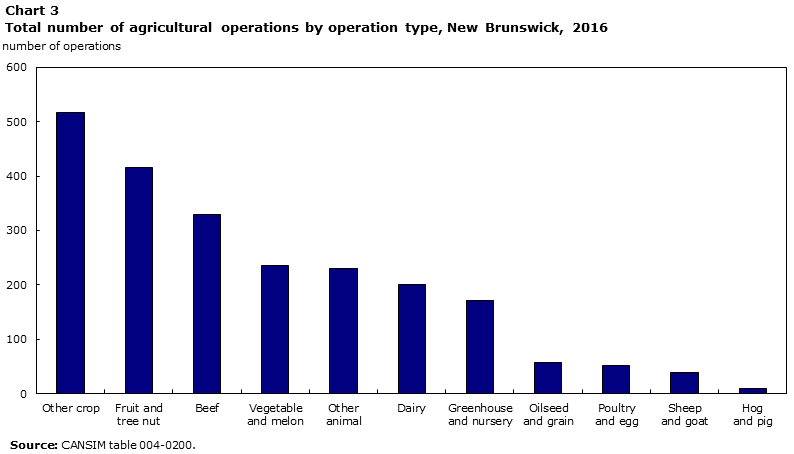
Data table for Chart 3
| Operation type | Number of operations |
|---|---|
| Other crop | 517 |
| Fruit and tree nut | 415 |
| Beef | 329 |
| Vegetable and melon | 236 |
| Other animal | 230 |
| Dairy | 201 |
| Greenhouse and nursery | 171 |
| Oilseed and grain | 58 |
| Poultry and egg | 51 |
| Sheep and goat | 38 |
| Hog and pig | 9 |
| Source: CANSIM table 004-0200. | |
Livestock numbers continue to decline
The number of dairy cows in New Brunswick declined 2.7% from 2011 to 18,031 head in 2016, while the number of farms reporting dairy cows decreased 11.7%.
Annual milk production rose 7.1% from 2011 to 144.2 million litres in 2016 (CANSIM table 003-0011, accessed April 21, 2017). The decline in the number of dairy cows was more than offset by increased production per animal, attributable to improvements in animal nutrition, genetics and production practices.
The number of beef cattle declined 16.7% from 2011 to 22,001 head in 2016, as some producers took advantage of higher prices to retire or shift focus to other types of agricultural production. The number of farms reporting beef cattle declined 19.0%.
The number of pigs in New Brunswick decreased 43.8% from 2011 to 30,715 head in 2016—the largest absolute decrease in pig numbers in Canada. New Brunswick ranked eighth nationally in the number of pigs. Given the smaller nature of the sector in the Atlantic provinces, producers had a more difficult time recovering from poor market conditions prior to 2011. High feed and transportation costs contributed to reduced profitability and many operations ceased production.
The sheep flock declined 19.4% from 2011 to 7,481 animals in 2016.
The average age of operators remains stable
New Brunswick reported 3,005 farm operators in 2016, down 13.4% from 2011 and similar to the decline in farm numbers (-13.6%).
Women accounted for 22.2% of farm operators in 2016, up from the 20.9% in 2011 but below the national average of 28.7%.
The average age of farm operators in New Brunswick edged up from 55.5 years old in 2011 to 55.6 in 2016. Meanwhile, the proportion of younger farm operators (under 35 years old) increased from 6.4% in 2011 to 8.6% in 2016.
| Age group | 2011 | 2016 |
|---|---|---|
| Percent of farm operatorsTable 3 Note 1 | ||
| Under 35 years old | 6.4 | 8.6 |
| 35 to 54 years old | 39.1 | 34.2 |
| 55 years and older | 54.5 | 57.2 |
| Total farm operators | 100.0 | 100.0 |
|
||
In 2016, 37.0% of farm operators in New Brunswick worked more than 40 hours a week on average on farm operations during 2015, compared with 37.2% in 2010. At the national level, this percentage was 37.5% in 2015.
Meanwhile, fewer farmers worked off the farm in 2015, with 44.3% of farm operators in New Brunswick reporting an off farm job, down slightly from 44.7% in 2010. Nationally, 44.4% of farm operators worked off the farm.
Expenses decline faster than gross farm receipts
Gross farm receipts in New Brunswick were $619.4 million in 2015, while operating expenses were $524.1 million. On average, for every dollar in receipts, farms had $0.85 in expenses in 2015 for an expense-to-receipt ratio of 0.85. In 2010, New Brunswick’s expense–to-receipt ratio was 0.86. New Brunswick was the lone province in Atlantic Canada to see an improvement in this ratio.
Start of text box
The expense-to-receipt ratio is the average amount of operating expenses incurred for a dollar in farm receipts. The ratio is calculated in current dollars.
Price indices were used to obtain constant dollar estimates of receipts, expenditures and capital values in order to eliminate the impact of price changes in year-to-year comparison.
Census Day was May 10, 2016. Farmers were asked to report their receipts and expenses for the last complete fiscal or calendar year (2015).
End of text box
The ratio of operating expense-to-receipt varied by farm type. Other crop farm types (including maple or potato farm types) had the most favourable ratio in 2015 (0.80), compared with 0.86 in 2010. Hog and pig farm types posted the largest improvement in the expense-to-receipt ratio, falling from 1.02 to 0.86. Meanwhile, the ratio for oilseed and grain farm types showed the largest deterioration, rising from 0.92 to 0.97.
Other agriculture highlights in New Brunswick
- In New Brunswick, 1.7% of farms reported having renewable energy producing systems in 2015 compared with 5.3% nationally.
- In New Brunswick, 27.5% of farms reported being incorporated in 2016, up from 22.1% in 2011 and above the national average of 25.1%.
- The 2016 Census of Agriculture marked the first time farm operators were asked to report if they had a written succession plan. In 2016, 7.1% of farms in New Brunswick had a written succession plan compared with 8.4% nationally.
- The proportion of farms producing organic products in New Brunswick edged down from 2.3% in 2011 to 2.2% in 2016. Nationally, farms producing organic products accounted for 2.2% of the total farms in 2016.
- In New Brunswick, 5.3% of farms reported using automated animal feeding technology in 2015.
- In New Brunswick, the value of the land and buildings per acre increased 17.4% (in 2016 constant dollars) from 2011 to $2,157 per acre in 2016. At the national level, this value was $2,696 per acre.
- In New Brunswick, 22.1% of farms reported selling agricultural products directly to consumers in 2015.
Canada 150: Farming in New Brunswick
New Brunswick was one of the original four provinces in Canada in 1867. In 1871, the first census after Confederation, there were 31,202 farms reported in the province, with 47,689 acres of potatoes. By 1921, the province was reporting 8,153 acres of fruits, berries and nuts and 104,439 maple taps. Potatoes remain a vital component to New Brunswick’s agriculture industry, ranking as the largest field crop in 2016. Fruits, berries and nuts area has increased, with 45,480 acres reported in 2016, more than five times the area reported in 1921. Similarly, there are over 21 times more maple taps in the province, with 2,285,785 taps reported in 2016.
Statistics Canada would like to thank the farming community of New Brunswick for their participation and assistance in the 2016 Census of Agriculture.
Start of text box
Census farm: An operation is considered a census farm (agricultural operation) if it produces at least one of the following products intended for sale:
- Crops: Hay, field crops, tree fruits or nuts, berries or grapes, vegetables, seed;
- Livestock: Cattle, pigs, sheep, horses, game animals, other livestock;
- Poultry: Hens, chickens, turkeys, chicks, game birds, other poultry;
- Animal products: Milk or cream, eggs, wool, furs, meat;
- Other agricultural products: Christmas trees, sod, greenhouse or nursery products, mushrooms, honey or bees, maple syrup and its products.
The data for Yukon and the Northwest Territories are not included in the national totals because of the different definition of an agricultural operation in the territories and confidentiality constraints. The data for Yukon and the Northwest Territories are presented separately.
Farm type: Farm type is established through a procedure that classifies each census farm according to the predominant type of production. This is done by estimating the potential receipts from the inventories of crops and livestock reported on the questionnaire and determining the product or group of products that make up the majority of the estimated receipts. For example, a census farm with total potential receipts of 60% from hogs, 20% from beef cattle and 20% from wheat, would be classified as a hog and pig farm. The farm types presented in this document are derived based on the 2012 North American Industrial Classification System (NAICS).
P.T.O. hp (Power Take Off horsepower): The measure of the power available from a tractor engine to drive implements.
Gross farm receipts: The Census of Agriculture measures gross farm receipts for the calendar or accounting year prior to the census. Gross farm receipts (before deducting expenses) in this analysis include:
- receipts from all agricultural products sold;
- program payments and custom work receipts.
The following are not included in gross farm receipts:
- sales of forestry products (for example: firewood, pulpwood, logs, fence posts and pilings);
- sales of capital items (for example: quota, land, machinery);
- receipts from the sale of any goods purchased only for retail sales.
Total operating expenses: The Census of Agriculture measures operating expenses for the calendar or accounting year prior to the census. Total operating expenses include:
- any expense associated with producing agricultural products (such as the cost of seed, feed, fuel, fertilizers, etc.).
The following are not included in total operating expenses:
- the purchase of land, buildings or equipment;
- depreciation or capital cost allowance. Depreciation represents economic "wear and tear" expense. Capital cost allowance represents the amount of depreciation written off by the tax filer as allowed by tax regulations.
2010 to 2015: Some data refer to a reference period other than Census Day. For example, for financial data the reference period is the calendar or accounting (fiscal) year prior to the census.
Farm operator: According to the census, a farm operator is any person responsible for the management decisions made for an agricultural operation as of May 10, 2016.
End of text box
Contact information
For more information, or to enquire about the concepts, methods or data quality of this release, contact us (toll-free 1-800-263-1136; 514-283-8300; STATCAN.infostats-infostats.STATCAN@canada.ca) or Media Relations (613-951-4636; STATCAN.mediahotline-ligneinfomedias.STATCAN@canada.ca).
- Date modified: