
Canadian Agriculture at a Glance
Dairy goats in Ontario: a growing industry

Archived Content
Information identified as archived is provided for reference, research or recordkeeping purposes. It is not subject to the Government of Canada Web Standards and has not been altered or updated since it was archived. Please "contact us" to request a format other than those available.
Skip to text
Text begins
In Canada, the word “milk” is often synonymous with cow’s milk, but farm operators are taking advantage of an increasingly diverse consumer demand to produce a broader range of products, including goat’s milk and cheese. Whether because of increased ethnocultural diversity or simply because of a changing Canadian palate, production of goat’s milk in Canada is on the rise (Canadian Dairy Information Centre, 2017).
Although the Census of Agriculture does not differentiate between goats for milk production and goats for meat production, estimates for goat’s milk production in Ontario can be obtained by combining census data with administrative data sources supplied by the Ontario Ministry of Agriculture, Food and Rural Affairs.
The number of dairy goats on agricultural operations in Ontario is increasing as farmers expand and optimize production. Gross farm receipts of goat type farms in Ontario increased from $31.6 million in 2011 to $41.7 million in 2016, although they remained considerably lower than those of dairy cattle and milk type farms, which reported $2.4 billion in 2016.
This document analyzes the characteristics of agricultural operations identified as possessing goats for milk production in Ontario in 2011 and 2016, and considers how they compare with other agricultural operations in the province.
Start of text box
Terms
- Known dairy goat farms refers to operations which were successfully linked to the Statistics Canada Business Register and possessed goats at the time of data collection. It does not necessarily constitute the full universe of dairy goat farms.
- Other farms with goats include all operations in Ontario that reported goats in the 2016 Census of Agriculture and were not linked to a registered dairy goat operation.
- Goat-type farms, dairy-type farms and others are classified using the North American Industry Classification System (NAICS).
- The expense-to-receipt ratio is the average amount incurred in operating expenses per dollar in gross farm receipts.
End of text box
Trend in goats in Canada
The number of goats in Canada increased 2.0% from 225,461 in 2011 to 230,034 in 2016 (Chart 1). The increase was largely driven by Ontario, where the number rose 12.0% to 130,219, representing 56.6% of all goats in Canada in 2016. The province with the second-highest number of goats was Quebec, with 15.5% of the national total in 2016.
Conversely, the number of agricultural operations reporting goats in Canada fell 5.4% during this five-year period. The average number of goats per farm reporting goats remained relatively stable at 41 goats per farm in 2016, up from 38 goats in 2011. This follows the trend of consolidation seen across the agricultural sector.
Data table for Chart 1
| Year | Operations with goats in Canada | Goats in Canada | Operations with goats in Ontario | Goats in Ontario |
|---|---|---|---|---|
| number of operations | number of goats | number of operations | number of goats | |
| 1981 | 10,127 | 89,839 | 4,212 | 45,500 |
| 1986 | 8,936 | 75,788 | 2,999 | 32,460 |
| 1991 | 7,735 | 88,116 | 2,400 | 33,405 |
| 1996 | 8,252 | 125,819 | 2,521 | 45,258 |
| 2001 | 7,706 | 182,851 | 2,342 | 62,310 |
| 2006 | 6,725 | 177,698 | 2,169 | 76,114 |
| 2011 | 5,949 | 225,461 | 2,152 | 116,260 |
| 2016 | 5,627 | 230,034 | 1,936 | 130,219 |
| Sources: CANSIM tables 004-0004 and 004-0224. | ||||
In 2016, 83,841 goats were reported on known dairy goat farms in Ontario, identified using administrative data. They accounted for approximately 64.4% of all goats in the province—an increase of 23.1% from the 68,123 identified in 2011.
Known dairy goat farms accounted for 206 farms in Ontario in 2016, little changed from 204 farms in 2011. However, analyses of farms exiting and entering the sector indicate that smaller operations have exited and have been replaced by larger operations. The result has been an increase in the average number of goats per known dairy goat farm, from 334 in 2011 to 407 in 2016. The average number of goats on any farm reporting goats was much lower because of the large number of farms that reported a small number of goats. This would not occur on farms specializing in goat dairy production.
Demographics of operators of known dairy goat farms in Ontario
The average age of dairy goat farm operators in Ontario decreased from 43.1 to 42.8 years, with farmers aged 50 to 54 accounting for the largest share of farm operators (Chart 2a). The average age of a dairy goat farm operator in Ontario in 2016 was 12.5 years younger than the average operator age in Ontario, at 55.3. This may be because of the lower cost of entry compared with other livestock farming, such as dairy cattle farming.
Data table for Chart 2a
| Ontario dairy goat farm operators | All Ontario farm operators | |
|---|---|---|
| percentage of operators | ||
| Younger than 25 years | 5.2 | 1.3 |
| 25 to 29 years | 10.6 | 3.2 |
| 30 to 34 years | 14.3 | 4.9 |
| 35 to 39 years | 12.8 | 5.9 |
| 40 to 44 years | 12.0 | 6.6 |
| 45 to 49 years | 11.7 | 9.1 |
| 50 to 54 years | 15.0 | 14.0 |
| 55 to 59 years | 9.2 | 16.0 |
| 60 to 64 years | 6.9 | 13.3 |
| 65 to 69 years | 0.9 | 10.1 |
| 70 to 74 years | 0.6 | 7.4 |
| 75 years and older | 0.9 | 8.4 |
| Source: Census of Agriculture (3438). | ||
The decline in the average age of operators of known dairy goat farms stands in contrast to the overall trend of Canadian farm operators, who have shown an increase in age since 1991.
Data table for Chart 2b
| 2016 | 2011 | |
|---|---|---|
| percentage of operators | ||
| Younger than 25 years | 5.2 | 5 |
| 25 to 29 years | 10.6 | 9.1 |
| 30 to 34 years | 14.3 | 9.6 |
| 35 to 39 years | 12.8 | 13.2 |
| 40 to 44 years | 12 | 16.8 |
| 45 to 49 years | 11.7 | 14.9 |
| 50 to 54 years | 15 | 14.4 |
| 55 to 59 years | 9.2 | 10.9 |
| 60 to 64 years | 6.9 | 3.6 |
| 65 to 69 years | 0.9 | 1.1 |
| 70 to 74 years | 0.6 | 0.8 |
| 75 years and older | 0.9 | 0.6 |
| Source: Census of Agriculture (3438). | ||
In 2016, Ontario dairy goat farm operators reported a higher proportion of younger operators than average farms in the province. The proportion of operators younger than 35 years of age on known dairy goat farms was 30.0%—more than three times higher than the proportion of all operators younger than 35 in Ontario (9.4%). It is possible that younger farm operators wishing to enter into milk production turn to dairy goat farming as an alternative to dairy cattle.
There were 350 operators of known dairy goat farms in Ontario, of whom 35.1% were female and 64.9% were male. The female-to-male ratio was higher than that for all remaining Ontario agricultural operators, of whom 29.7% were female and 70.3% were male.
Of the 206 known dairy goat farms in Ontario, 41.3% were operated exclusively by male operators, compared with 58.3% of total operations in Ontario. Fewer dairy goat farms were operated exclusively by female operators (2.4%), compared with 7.1% of total Ontario operations. More than half of known dairy goat farms (56.3%) reported at least one male and one female operator, compared with 34.5% of total Ontario operations.
Dairy goat farm operators in Ontario were more likely to report working more than 40 hours per week on the farm than the average Ontario operator (Chart 3). However, dairy goat farm operators and operators of dairy cattle type farms saw similar trends in reported working hours, highlighting a similarity in how farms producing milk function in contrast with other farm types.
Data table for Chart 3
| Dairy goat farm operators | Dairy cattle farm operators | All Ontario farm operators | |
|---|---|---|---|
| percentage of operators | |||
| More than 40 hours | 71 | 78 | 34.1 |
| 30 to 40 hours | 10.9 | 7.8 | 13.9 |
| 20 to 29 hours | 8.9 | 6.4 | 16.4 |
| Less than 20 hours | 9.2 | 7.9 | 35.6 |
| Source: Census of Agriculture (3438). | |||
With more hours worked on the farm, dairy goat farm operators were less likely to report working off the farm; 69.4% reported no off-farm work. Dairy goat farmers were more similar to operators of dairy cattle type farms in this regard than to the average agricultural operator in Ontario.
Land tenure for dairy goat farms followed the same general pattern as the agricultural population as a whole in Ontario. The area owned comprised 67.2% of total tenure for dairy goat farms, compared with 67.6% of tenure for all Ontario farms. The area rented from others comprised 31.1% of tenure for dairy goat farms and 27.4% of tenure for all Ontario farms. Dairy goat farms with 1,000 or more goats reported more rented land than owned overall, while those with fewer than 1,000 goats owned more land than they rented overall (Table 1). A higher number of goats requires more growing area for hay and feed. Operators of larger dairy goat farms may need to rent land to meet their goats’ dietary needs.
| Number of goats | Area owned | Area rented | ||
|---|---|---|---|---|
| Farms | Acres | Farms | Acres | |
| Fewer than 200 | 44 | 5,586 | 9 | 716 |
| 200 to 399 | 78 | 11,558 | 47 | 4,557 |
| 400 to 999 | 58 | 8,873 | 24 | 3,272 |
| 1,000 or more | 12 | 3,859 | 9 | 5,263 |
| Total | 192 | 29,876 | 89 | 13,808 |
| Source: Census of Agriculture (3438). | ||||
Location of dairy goat farms
Many of Ontario’s dairy goat farms were concentrated in census agricultural regions 1 and 2, which encompass most of southern Ontario (Map 1).
Map 1
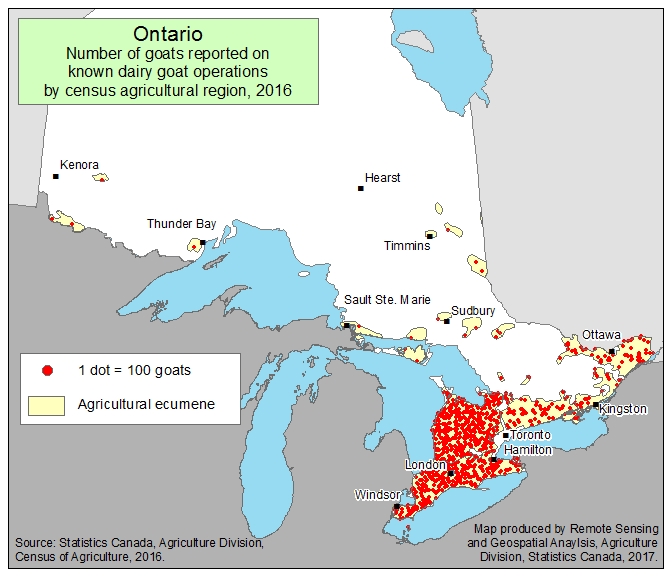
Description for Map 1
This map shows the number of goats reported on known dairy goat operations by census agricultural region, 2016.
Legend
Each red dot represents a number of 100 goats. The dots are placed randomly inside the census agricultural region's agricultural area, displayed in a yellow background. The non-agricultural areas of Ontario are shown in white.
Provinces are outlined in a thick black line. Background of provinces other than Ontario are in light grey. United States are shown in dark grey.
Census agricultural regions are outlined in a thin grey line.
Main cities are shown on the map.
Data table
The following table lists the census agricultural regions for the province of Ontario, their associated data values and the number of dots displayed by region.
| Census agricultural region unique identifier | Census agricultural region name | Number of goats | Number of dots |
|---|---|---|---|
| 3501 | Southern Ontario Region | 29,833 | 298 |
| 3502 | Western Ontario Region | 38,658 | 387 |
| 3503 | Central Ontario Region | 6,625 | 66 |
| 3504 | Eastern Ontario Region | 7,225 | 72 |
| 3505 | Northern Ontario Region | 1,500 | 15 |
Source
Statistics Canada, Agriculture Division, Census of Agriculture, 2016.
Map produced by Remote Sensing and Geospatial Analysis, Agriculture Division, Statistics Canada, 2017.
Finances on dairy goat farms
A higher proportion of dairy goat farms were in the middle and upper sales classes, compared with the distribution of all other farms in Ontario. Farms reporting sales between $100,000 and $249,000 accounted for the largest proportion of known dairy goat farms in the province.
Data table for Chart 4
| Percentage of farms | Percentage of gross farm receipts | |
|---|---|---|
| percent | ||
| $1 to $9,999 | 2.4 | 0.0 |
| $10,000 to $24,999 |
2.9 | 0.1 |
| $25,000 to $49,999 |
4.9 | 0.5 |
| $50,000 to $99,999 |
11.7 | 2.8 |
| $100,000 to $249,999 |
34.0 | 16.6 |
| $250,000 to $499,999 |
22.8 | 23.6 |
| $500,000 to $999,999 |
17.0 | 34.9 |
| $1,000,000 or more |
4.4 | 21.4 |
| Source: Census of Agriculture (3438). | ||
The majority of known dairy goat farms in Ontario had fewer than 1,000 goats in 2016. Those with fewer than 1,000 goats were also more profitable, with an expense-to-receipt ratio of 0.85, while the expense-to-receipt ratio of those reporting more than 1,000 goats was less favourable, at 0.88 (Table 2). The ratio for agricultural operations in Ontario as a whole was 0.85.
| Number of goats | 2011 | 2016 |
|---|---|---|
| Fewer than 200 | 0.89 | 0.85 |
| 200 to 399 | 0.89 | 0.83 |
| 400 to 999 | 0.88 | 0.86 |
| 1,000 or more | 0.81 | 0.88 |
| Source: Census of Agriculture (3438). | ||
According to the 2016 Census of Agriculture, there were 1,730 other farms with goats. These operations were more likely to have fewer than 200 goats (Table 3), and this is probably attributable to the common practice of keeping one or two goats for non-industrial purposes. Other farms with goats were more likely to have a more favourable expense-to-receipt ratio if they had more goats, unlike dairy goat farms, but in keeping with the trend of larger farms being more profitable.
| Number of goats | Farms | Goats | Expense-to-receipt ratio |
|---|---|---|---|
| Fewer than 200 | 1,691 | 32,717 | 0.87 |
| 200 to 399 | 29 | 7,353 | 0.82 |
| 400 or more | 10 | 6,308 | 0.82 |
| Source: Census of Agriculture (3438). | |||
Despite the small number of dairy goat farms with 1,000 goats or more, these operations employed the majority of year-round employees on known dairy goat farms in 2016 (243 employees). In comparison, all other known dairy goat farms in Ontario employed 90 year-round employees.
As dairy goats require year-round daily milking, the number of seasonal employees was small in all size classes, totalling 57 for all known dairy goat farms.
Larger dairy goat farms were more likely to report the use of automated environmental controls for building management: 57.1% of operators reporting 1,000 goats or more said they used such controls, compared with 2.2% of those reporting fewer than 200 goats.
| Number of goats | Farms | Farms reporting environmental controls | Percentage of farms in category |
|---|---|---|---|
| Fewer than 200 | 46 | 1 | 2.2 |
| 200 to 399 | 86 | 22 | 26.8 |
| 400 to 999 | 60 | 22 | 40.0 |
| 1,000 or more | 14 | 8 | 57.1 |
| Source: Census of Agriculture (3438). | |||
Ontario dairy goat farms were more likely to be reported as partnerships and less likely to be reported as sole proprietorships or corporations than the average Ontario agricultural operation in 2016. Farms reported as sole proprietorships made up 51.6% of operations in Ontario, but only 33.0% of dairy goat farms. Those reported as corporations comprised 22.0% of operations in Ontario and 20.4% of dairy goat farms in the province. Partnerships comprised 26.4% of operations in Ontario, compared with 46.6% of dairy goat farms.
| Known dairy goat farms | |||
|---|---|---|---|
| Operating arrangements | Farms | Goats | Percentage of farms |
| Sole proprietorship | 68 | 21,619 | 33.0 |
| Partnership without a written agreement | 70 | 26,910 | 34.0 |
| Partnership with a written agreement | 26 | 10,016 | 12.6 |
| Family corporation | 39 | 24,581 | 18.9 |
| Non-family corporation | 3 | 715 | 1.5 |
|
Note: Totals may not equal 100% because of rounding. Source: Census of Agriculture (3438). |
|||
Appendix
Ontario Dairy Goat Linkage Methodology
Linkage process:
In an effort to use administrative data to provide supplementary data regarding agricultural activities, a linkage was established between the Ontario Registry for Dairy Goat Farms and the agricultural frame on the Business register (BR).
The purpose of the linkage was to identify the potential number of dairy goats located on farms known to produce goat milk as established by the Ontario Registry for Dairy Goat Farms.
After cross-referencing and updating the Statistics Canada’s Business Register with Census of Agriculture (CEAG) data, a snapshot was taken which identified possible linkages between census data and Ontario Registry for Dairy Goat Farms data.
This linkage was conducted using a program which returns probabilistic matches based on the association of specific matching fields such as contact names, business names, addresses and phone numbers.
Linkages proven to be a (strong) match were accepted, while those linkages to multiple records options were examined to identify the most likely match. In instances where automatic linkages were not established, records were reviewed manually to establish a linkage when possible.
The linkage rate between the Ontario Registry for Dairy Goat Farms and the Census of Agriculture was 86.4%.
To ensure the integrity of the data, only records that were successfully matched were included for analysis. Furthermore, all goats located on what were deemed to be dairy goat operations were, for the purpose of this study, considered dairy goats, as the census of agriculture lacks a breakdown of goats by specific purpose.
Sample constraints:
In cases where a linked operation reported no goats on the Census of Agriculture, a manual review was undertaken to confirm other potential linkage options. If another linkage was successful, it replaced the link with a previous operation on the Census of Agriculture.
Linkage confrontation:
In cases where operations reported no goats on the Census of Agriculture but were present on both the Business Register and Ontario Registry for Dairy Goat Farms, tax data (principally, milk and cream tax indicators) were used to identify potential matches.
These potential matches would then be reviewed manually in order to establish a linkage.
Instances where dairy goat operations were found on the Ontario Registry for Dairy Goat farms but absent from any Census of Agriculture inventory, were excluded from further analysis. As a result, the data included in this article represents an approximation which could be affected by linkages to the Business Register, as well as differences in timing between the collection of administrative data source and collection of the Census of Agriculture.
Terminology:
Known dairy goat farms: refers to operations which were successfully linked to the Statistics Canada Business Register and possessed goats at the time of data collection. It does not necessarily constitute the full universe of dairy goat farms.
Business Registry: comprises all units in all economic sectors involved in economic production in Canada.
Agricultural Frame: refers to any agricultural operations that is in operation and known to the Census of Agriculture and agricultural surveys.
Census of Agriculture data: refers to all commodities, finances, operators and operational attributes collected to form a statistical portrait of Canada’s agriculture industry.
References
Canadian Dairy Information Centre. 2017. Goat Milk Production in Canada. Retrieved July 24, 2017, from http://www.dairyinfo.gc.ca/index_e.php?s1=dff-fcil&s2=farm-ferme&s3=prod&s4=gc.
Ontario Dairy Goat Co-operative. 2010. Goat Farming. Retrieved July 24, 2017, from http://www.ontariodairygoat.com/goat-farming.htm.
- Date modified: