


|
|
| |
Archived ContentInformation identified as archived is provided for reference, research or recordkeeping purposes. It is not subject to the Government of Canada Web Standards and has not been altered or updated since it was archived. Please "contact us" to request a format other than those available. 
The Daily. Wednesday, May 8, 2002 Canadian Community Health Survey: A first look2000/01Although the proportion of people who are active in their leisure time has grown, the proportion who are obese has also increased, according to new results from the Canadian Community Health Survey (CCHS). This survey provides a wealth of data on Canadians' health status, risk factors, and health care use. This release provides links to a number of maps and tables with additional data. CCHS data show that from 1994/95 to 2000/01, the number of obese Canadians aged 20 to 64 grew by 24% (or more than 500,000 to almost 2.8 million). These individuals represented about 15% of the adult population, or one out of every seven people, up from 13% six years earlier. 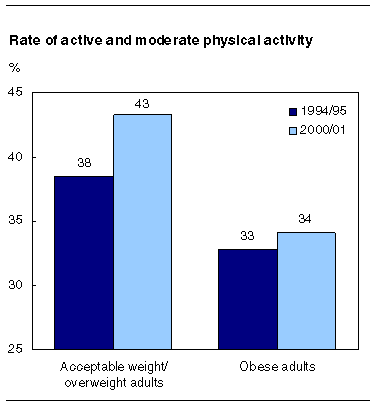
At the same time, 7.8 million Canadians in the same age group were classified as active or moderately active in their leisure time, up 21% from 1994/95. They represented 41% of the population in 2000/01, compared with 37% six years earlier.
However, the CCHS showed clearly that the individuals who were most in need of physical activity - that is, obese people - were the least active. In 1994/95, about 33% of obese people participated in at least moderate physical activity. This proportion remained essentially unchanged in 2000/01. Rather, the increase was entirely attributable to individuals whose weight was in the acceptable range, or who were considered overweight. In 1994/95, 38% of these people were at least moderately active. Six years later, that proportion had increased to 43%. A 1999 study published by the Canadian Medical Association Journal estimated that in 1997, the total direct cost of obesity was more than $1.8 billion, or 2.4% of total health care expenditures for all diseases. The World Health Organization has predicted that obesity could have as great an impact on health as smoking. Comparable statistics for the United States show that 20% of the adult population aged 18 and older were considered obese in 2000, compared with only 14% in 1994. This increase was much larger than in Canada, where levels increased by only two percentage points to 15% during the same period. Obesity increasing faster among baby boom menFrom 1994/95 to 2000/01, the number of adults aged 20 to 64 who were considered obese increased by an estimated 532,000. Men accounted for two-thirds of the increase during this six-year period. In 2000/01, an estimated 1,508,000 men were considered obese, up 32% from 1994/95. In contrast, the number of obese women rose 15% to 1,280,000. Obesity is on the rise for all age-sex groups except among women aged 20 to 34, where it fell 9% during the six-year period. Increases were greatest among men and women aged 45 to 54, who alone accounted for one-fourth of all obese adults in Canada. Rates of obesity increase with age, and were highest in the 55 to 64 age group (19%), and slightly lower in the 45 to 54 age group (18%). Overall, the number of obese adult women increased by 169,000 during this six-year period. More than half of this increase occurred among women aged 45 to 54. Part of the increased number of obese adults in older segments of the population can be attributed to the aging of the baby boomers. During the same six-year period, the age group 45 to 54 was the fastest-growing segment of the population - advancing 25% compared with 7% overall for the population aged 20 to 64. The increasing number of people entering this age group has had a compounding effect on obesity numbers. Obesity levels have increased at far greater rates among men than women. In 1994/95, roughly 13% of both men and women aged 20 to 64 were considered obese. A gap between the sexes had emerged by 2000/01, with 16% of men and 14% of women considered obese. Obesity increased in most provinces from 1994/95 to 2000/01, with the largest growth in Alberta. An estimated 290,000 individuals aged 20 to 64 were considered obese in Alberta in 2000/01, up 55% from six years earlier. However, census data show Alberta's population increased 10.3% from 1996 to 2001. This large influx of people may have been a factor in the province's substantial increase in obesity levels. Women catching up with men in leisure time physical activityWomen have almost caught up with men in levels of leisure time physical activity. Focussing on the same 20 to 64 age group, about 36% of women were physically active in 1994/95, compared with 39% of men. By 2000/01, a larger increase in physical activity for women had closed the gap to 41% of women and 42% of men in this age range. The prevalence of physical activity increased in almost all age groups, with the largest gain occurring among 20- to 34-year-olds. The highest level of physical activity in any age group was among those aged 12 to 19 (59%), though this rate was virtually unchanged from six years earlier. Above age 65, physical activity rates were the lowest, at about 34%, also unchanged from six years earlier. Physical activity rates rose in six provinces and were essentially unchanged in Newfoundland and Labrador, New Brunswick, Manitoba, Saskatchewan and British Columbia. Almost one-half (49%) of individuals aged 12 and over in British Columbia were physically active - the highest proportion among the provinces. Wide range of regional health data available for the first timeThe CCHS marks a turning point in collecting information on the health of Canadians. For the first time, health-related characteristics of the population can be compared not only at provincial and territorial levels, but at the sub-provincial health region level as well. (A health region is defined by provincial governments as the area of responsibility for regional health boards, or as a region of interest to health care authorities.) These estimates help researchers and analysts track population health and the impact of health programs by health region. The survey results will also allow more detailed study of groups with special circumstances, including seniors, off-reserve Aboriginals, and single mothers. Large urban areas have lowest obesity ratesObesity and physical activity levels varied considerably across the 136 health regions, for which 2000/01 information is available. Overall, only 13 health regions had obesity levels lower than the national average of 15%. These regions are all located in Ontario, Quebec and British Columbia and most are associated with Montréal, Toronto and Vancouver, where the average obesity rate ranged from 6% to 12%. A total of 51 health regions had obesity levels higher than the Canadian average. All provinces and territories had at least one health region showing an obesity rate above the national average. To view a map of obesity levels in Canada go to Health indicators map. To view obesity levels by health region go to Health indicators table on obesity. Physical activity varies by regionIn total, 25 health regions recorded levels of physical activity significantly lower than the national average of 43%. However, there were 55 regions reporting physical activity levels higher than the national average. These regions were mostly located in Quebec and all provinces moving west. Ontario, Alberta and British Columbia accounted for 46 of the 55 regions. To view a map of physical activity levels in Canada go to Health indicators map. To view physical activity levels by health region go to Health indicators table on physical activity. Self-reported unmet health care needs by health regionAmong the wide range of data collected by the CCHS, respondents were asked about self-perceived unmet health care needs, that is, health care that they felt they needed but did not receive. As reported in the Daily on March 13 of this year, 12.5% of individuals aged 12 or older, or about 3.2 million people, reported unmet health care needs in 2000/01, double the proportion of two years earlier (6.3%). On a regional basis, the proportion of people who reported unmet health care needs in individual health regions ranged from a low of 8% in Eastern Ontario to a high of 28% in the Manitoba region of Burntwood/Churchill. Respondents cited reasons for unmet health needs including both features of the health care system and individual factors. Among the health system characteristics, "waiting time too long" was reported by 31% of those with unmet needs, followed by "service not available when needed" (17%). Personal circumstances were also reported as important, but by fewer of those with unmet needs. The most common reasons reported were that they "did not get around to it" (10%) or they were "too busy" (10%). To view other tabulations released from this survey, visit Health indicators (82-221-XIE). To request custom tabulations, contact the Client Services Unit (613-951-1746). A public use micro-data file will be released in the summer of 2002. New Health indicators from Statistics Canada are available free through a special CANSIM II interface. Health indicators (82-221-XIE, free) is now available on Statistics Canada's Web site (). From the Our products and services page, choose Free publications, then Health. For more information, contact Jason Gilmore (613-951-7118; jason.gilmore@statcan.gc.ca), Statistics Canada. For more information, or to enquire about the concepts, methods or data quality of this release contact Larry MacNabb (613-951-4269; fax 951-4198; larry.macnabb@statcan.gc.ca), Health Statistics Division. Active and moderate physical activity
Counts and rates by body mass index (international standard)
Counts and rates of active and moderate physical activity
| |||||||||||||||||||||||||||||||||||||||||||||||||||||||||||||||||||||||||||||||||||||||||||||||||||||||||||||||||||||||||||||||||||||||||||||||||||||||||||||||||||||||||||||||||||||||||||||||||||||||||||||||||||||||||||||||||||||||||||||||||||||||||||||||||||||||||||||||||||||||||||||||||||||||||||||||||||||||||||||||||||||||||||||||||||||||||||||||||||||||||||||||||||||||||||||||||||||||||||||||||||||||||||||||||||||||||||||||||||||||||||||||||||||||||||||||||||||||||||||||||||||||||||||||||||||||||||||||||||||||||||||||||||||||||||||||||||||||||||||||||||||||||||||||||||||||||||||||||||||||||||||||||||||||||||||||||||||||||||||||||||||||||||||||||||||||||||||||||||||||||||||||||||||||||||||||||||||||||||||||||||||||||||||||||||||||||||||||||||||||||||||||||||||||||||||||||||||||||||||||||||||||||||||||||||||||||||||||||||||||||||||||||||||||||||||||||||||||||||||||||||||||||||||||||||||||||||||||||||||||||||||||||||||||||||||||||||||||||||||||||||||||||||||||||||||||||||||||||||||||
|
|
|

