


|
|
| |
Information identified as archived is provided for reference, research or recordkeeping purposes. It is not subject to the Government of Canada Web Standards and has not been altered or updated since it was archived. Please "contact us" to request a format other than those available.

|

Friday, November 7, 2003 Labour Force SurveyOctober 2003Employment rose by an estimated 65,000 in October, almost all in full-time jobs. This was the second consecutive increase in employment, following slow growth earlier in the year. Since the start of 2003, employment has grown by 1.0% (+164,000). The unemployment rate fell 0.4 percentage points in October to 7.6%. 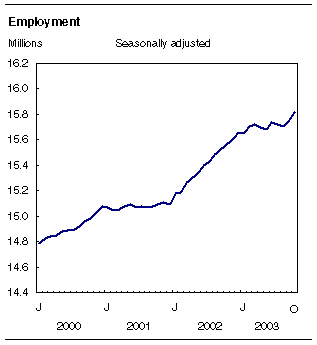
Strong increase in employment for adult womenBuoyed by a robust increase in full-time employment, the number of jobs among adult women rose by 41,000 in October. This job growth pushed their unemployment rate down 0.3 percentage points to 6.2%. Since the start of 2003, employment among adult women has grown by 95,000 (+1.5%). Employment among adult men increased by 28,000 in October, mostly in part-time work. So far this year, employment gains for adult men total 78,000 (+1.1%). In October, their unemployment rate was 6.6%, down 0.3 percentage points from September. Although youth employment was little changed in October, there was a large drop in the number of youths looking for work, causing their unemployment rate to drop 0.6 percentage points to 14.0%. While employment among adult men and women has increased in the last couple of months, youth employment has yet to show any rebound. So far in 2003, youth employment is down 0.4%. Job growth continues in health care and social assistanceIn October, employment grew by an estimated 20,000 in the health care and social assistance sector, continuing the upward trend that began two years ago. So far in 2003, this industry has added 56,000 jobs (+3.4%). Most of October's employment gains in health care and social assistance occurred in Quebec. 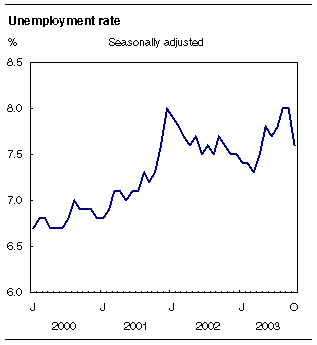
Employment in management of companies and administrative and other support services increased by 13,000 in October, mostly in Ontario. Despite recent strength, employment in this industry is little changed compared with the end of 2002. For a second consecutive month, employment grew by 13,000 in the finance, insurance, real estate and leasing industry, bringing growth since the start of 2003 to 50,000 jobs (+5.5%). In October, job growth in this industry occurred mainly in British Columbia and Alberta. After three months of little change, employment edged up 11,000 in transportation and warehousing in October. The increase was concentrated in the trucking industry. Employment in natural resources rose for a second consecutive month, with the number of jobs growing by 7,000 in October. This increase occurred primarily in oil and gas in Alberta. The natural resources sector has seen strong employment growth thus far in 2003, with the number of jobs increasing by 30,000 (+11.0%). In the manufacturing sector, employment was little changed during the month of October. A decrease in manufacturing employment in Ontario was offset by slight increases in most other provinces. Since the start of 2003, the number of manufacturing jobs has fallen by an estimated 77,000 (-3.3%). Following several months of growth, employment in construction edged down by 10,000 in October, as a result of declines in Ontario and Alberta. Despite October's decrease, construction employment is up 34,000 (+3.8%) compared with December 2002. Job gains in both private and public sectorsFor a second consecutive month the number of private sector employees increased, with a gain of 34,000 in October. After remaining flat for the first seven months of the year, the number of employees in the private sector is now slightly higher than at the end of 2002. Public sector employment has also strengthened in recent months, including an increase of 27,000 employees in October. Since the start of 2003, the number of public sector employees has risen by 72,000 (+2.4%). Most of national employment increase in British Columbia and QuebecIn British Columbia, employment jumped by an estimated 30,000 in October. This is consistent with a number of positive signs of economic growth in the province, including strength in both residential and non-residential building permits, retail trade, oil and gas exploration, as well as lumber and paper shipments. The jump in employment in October in the province follows a slight decline the month before, and slow growth earlier in the year. Youths accounted for half of the employment gain in October. By industry, the gains were widespread, with the largest increases occurring in public administration, finance, insurance, real estate and leasing, and transportation and warehousing. The unemployment rate dropped 1.3 percentage points in October to 7.8%. An increase in part-time work pushed employment in Quebec up 26,000 in October, bringing employment to the same level as in December 2002. Employment among adult women grew substantially in October, with the increase concentrated in health care and social assistance and in retail and wholesale trade. The provincial unemployment rate fell 0.3 percentage points in October to 9.3%. In Manitoba, an increase of 6,000 jobs, all in full time, offset the loss in September. This leaves employment little changed compared to the start of the year. The unemployment rate fell 0.5 percentage points in October to 5.3%. After strong growth the month before, employment in Ontario was little changed in October (+5,000). An increase of 27,000 full-time jobs was offset by a decrease in part-time work. By industry, employment rose in educational services and in accommodation and food services but declined in manufacturing and construction. Because fewer people were looking for work in October, the unemployment rate fell 0.3 percentage points to 7.0%. Ontario has added 91,000 jobs since the start of the year (+1.5%), all of them full-time. With a decrease in part-time work in October, employment fell by 4,000 in Nova Scotia, leaving employment at nearly the same level as at the end of 2002. October's decrease was concentrated in the accommodation and food services industry. The province's unemployment rate edged down in October to 9.5% (-0.2 percentage points), due to lower labour force participation. Employment in Newfoundland and Labrador fell by 4,000 in October, with most of the decline among youths. The largest job losses were in manufacturing and trade. The unemployment rate edged up in October to 16.5% (+0.1 percentage point). Despite this decline in employment, the province has added 3,000 jobs (+1.4%) since the start of 2003. Employment was little changed in the other provinces in October. Available on CANSIM: tables 282-0001 to 282-0042 and 282-0047 to 282-0095. Definitions, data sources and methods: survey number 3701. Available at 7:00 am on Statistics Canada's website (). From the home page, choose Today's news releases from The Daily, then Latest Labour Force Survey. A more detailed summary, Labour force information, is available today for the week ending October 18 (71-001-XIE, $9/$84). The next release of the Labour Force Survey will be on Friday, December 5. For general information or to order data, contact Client Services (1-866-873-8788; 613-951-4090; labour@statcan.gc.ca). To enquire about the concepts, methods or data quality of this release, contact Vincent Ferrao (613-951-4750), or Stéphanie Langlois (613-951-3180), Labour Statistics Division.
| |||||||||||||||||||||||||||||||||||||||||||||||||||||||||||||||||||||||||||||||||||||||||||||||||||||||||||||||||||||||||||||||||||||||||||||||||||||||||||||||||||||||||||||||||||||||||||||||||||||||||||||||||||||||||||||||||||||||||||||||||||||||||||||||||||||||||||||||||||||||||||||||||||||||||||||||||||||||||||||||||||||||||||||||||||||||||||||||||||||||||||||||||||||||||||||||||||||||||||||||||||||||||||||||||||||||||||||||||||||||||||||||||||||||||||||||||||||||||||||||||||||||||||||||||||||||||||||||||||||||||||||||||||||||||||||||||||||||||||||||||||||||||||||||||||||||||||||||||||||||||||||||||||||||||||||||||||||||||||||||||||||||||||||||||||||||||||||||||||||||||||||||||||||||||||||||||||||||||||||||||||||||||||||||||||||||||||||||||||||||||||||||||||||||||||||||||||||||||||||||||||||||||||||||||||||||||||||||||||||||||||||||||||||||||||||||||||||||||||||||||||||||||||||||||||||||||||||||||||||||||||||||||||||||||||||||||||||||||||||||||
|
|
|

