


|
|
| |
Information identified as archived is provided for reference, research or recordkeeping purposes. It is not subject to the Government of Canada Web Standards and has not been altered or updated since it was archived. Please "contact us" to request a format other than those available.

|

Friday, November 5, 2004 Labour Force SurveyOctober 2004Employment rose by an estimated 34,000 in October, the second consecutive monthly increase, following little change over the summer months. The unemployment rate was unchanged in October at 7.1% as more people entered the labour force. Job growth is up 1.2% (+190,000) so far this year with all of the gains in full-time employment, while hours worked have increased by 1.5%. 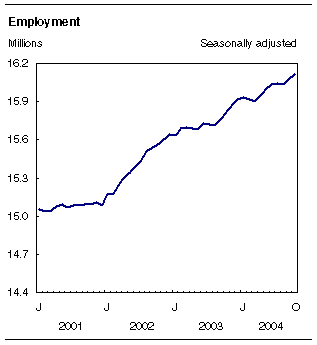
At the industry level, retail and wholesale trade, construction, finance, insurance, real estate and leasing, and professional, scientific and technical services have been the main source of job growth so far this year, while losses were concentrated in agriculture, and accommodation and food services. Among the provinces, New Brunswick, Newfoundland and Labrador, Nova Scotia, Manitoba, and Ontario have exceeded the national employment growth rate observed over the first 10 months of 2004.
More adult men workingEmployment rose by 20,000 in October among adult men, bringing gains so far this year to 118,000 (+1.6%). Full-time employment jumped by 33,000 in October while part-time employment edged down 13,000. All of the job gains so far this year among adult men have been in full-time work (+159,000). For adult women, employment was little changed for the fifth consecutive month. Over the first 10 months of 2004, employment among adult women has risen by only 0.7% (+45,000) and contrasts with the first 10 months of 2003 when employment grew by 1.8% (+109,000). There was little change in youth employment in October. Youth employment is up 1.1% (+27,000) so far this year, with most of the increase among older youths aged 20 to 24. More people working in salesIn October, employment increased by an estimated 45,000 in retail and wholesale trade with most of the gain occurring in Ontario. With October's increase, year-to-date employment gains for the sector total 68,000 (+2.7%). The increase in trade employment coincides with brisk sales at cash registers this year among retailers and wholesalers. The construction sector continued to be a pillar of strength for employment, adding 14,000 jobs in October. Employment in construction has shown an upward trend for about three years and gains over the first 10 months of 2004 total 56,000 (+5.8%). Employment gains in construction have been particularly strong so far this year in British Columbia, Alberta and Saskatchewan. Despite a decline of 16,000 in finance, insurance, real estate and leasing in October, employment in the sector has been robust over the first 10 months of 2004, up 3.6% (+35,000). 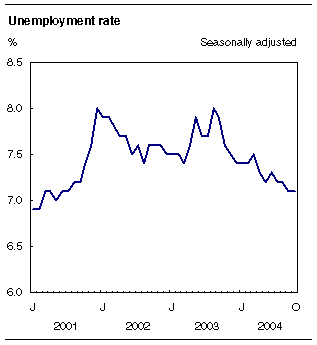
Employment also fell in transportation and warehousing in October, down 19,000, mostly in Ontario. The decline this month leaves employment in the sector at about the same level as at the start of the year. The manufacturing sector continued to show little change in October as a decline of 19,000 jobs in Quebec was mostly offset by slight gains in other provinces. Employment in manufacturing at the national level has changed little since the fall of 2003. Employment in public administration was unchanged in October. Although some employees in federal public administration were on strike during the Labour Force Survey reference week of October 10 to October 16, they are considered employed according to survey definitions. According to the Labour Force Survey, an estimated 60,000 federal employees were absent from work due to the labour dispute, resulting in the loss of 1.5 million hours or 25 hours per striking employee. More private sector employmentIn October, employment rose by 35,000 in the private sector with slight gains among private sector employees and the self-employed. There was no change in employment in the public sector. Over the first 10 months of 2004, the number of self-employed has grown by 2.0% (+48,000) and the number of private sector employees has increased by only 0.8% (+83,000). Over the same period, the public sector has expanded by 1.9% (+59,000). Provincial focusIn October, employment rose by 33,000 in Ontario, the first significant increase since last May. This leaves employment in the province up by 1.4% (+88,000) over the first 10 months of 2004. The increase in October was all in part-time work and was concentrated among adult women and youths. Gains occurred in retail sales, mostly in food and beverage as well as in general merchandise stores. There were also job increases in wholesale trade, mainly in machinery and equipment wholesalers and distributors. Employment also rose in accommodation and food services. Despite the substantial job gain in October, the unemployment rate was unchanged at 6.5%, the result of an increase in labour force participation. Employment increased in British Columbia for the second consecutive month (+12,000 in October), with all of the gains in full-time jobs. Increases in October were in professional, scientific and technical services as well as in construction and in agriculture. This recent employment strength offsets some of the weakness observed over the third quarter of the year and leaves employment in the province up 1.0% (+20,000) so far in 2004. Employment increased by 5,000 in Saskatchewan, all in full-time jobs. This pushed the unemployment rate down 0.6 percentage points to 5.2%. There were job gains in construction and other services such as repairs and maintenance. The increase in October offset most of the losses that occurred during May, June and July, leaving employment in the province up 1.0% so far in 2004. Employment in New Brunswick fell by 3,000 in October, pushing the unemployment rate up 0.5 percentage points to 10.1%. Losses were concentrated in health care and social assistance as well as in information, culture and recreation. Despite the decline in October, employment in the province is up 2.2% so far in 2004 and continues to be the highest rate of growth among the provinces. Employment in Quebec was little changed (-12,000) in October, leaving gains over the first 10 months of 2004 at 39,000 (+1.1%). The largest decline in October was in manufacturing, primarily in clothing, food products, and computer and electronics. Manufacturing losses were partly offset by an increase in construction. The unemployment rate increased 0.3 percentage points to 8.6%. There was little change in employment in the other provinces. Available on CANSIM: tables 282-0001 to 282-0042 and 282-0047 to 282-0095. Definitions, data sources and methods: survey number 3701. Available at 7:00 a.m. on Statistics Canada's Web site. From the home page, choose Today's news releases from The Daily, then Latest Labour Force Survey. A more detailed summary, Labour Force Information, is available today for the week ending October 16 (71-001-XIE, $9/$84). Data tables are also available in the Canadian statistics module of our Web site. The next release of the Labour Force Survey will be on Friday, December 3. For general information or to order data, contact Client Services (1-866-873-8788; 613-951-4090; labour@statcan.gc.ca). To enquire about the concepts, methods or data quality of this release, contact Vincent Ferrao (613-951-4750) or Stéphanie Langlois (613-951-3180), Labour Statistics Division.
| ||||||||||||||||||||||||||||||||||||||||||||||||||||||||||||||||||||||||||||||||||||||||||||||||||||||||||||||||||||||||||||||||||||||||||||||||||||||||||||||||||||||||||||||||||||||||||||||||||||||||||||||||||||||||||||||||||||||||||||||||||||||||||||||||||||||||||||||||||||||||||||||||||||||||||||||||||||||||||||||||||||||||||||||||||||||||||||||||||||||||||||||||||||||||||||||||||||||||||||||||||||||||||||||||||||||||||||||||||||||||||||||||||||||||||||||||||||||||||||||||||||||||||||||||||||||||||||||||||||||||||||||||||||||||||||||||||||||||||||||||||||||||||||||||||||||||||||||||||||||||||||||||||||||||||||||||||||||||||||||||||||||||||||||||||||||||||||||||||||||||||||||||||||||||||||||||||||||||||||||||||||||||||||||||||||||||||||||||||||||||||||||||||||||||||||||||||||||||||||||||||||||||||||||||||||||||||||||||||||||||||||||||||||||||||||||||||||||||||||||||||||||||||||||||||||||||||||||||||||||||||||||||||||||||||||||||
|
|
|

