
Statistics Canada
www.statcan.gc.ca
Common menu bar links
Study: Canada's economy in 2007

Archived Content
Information identified as archived is provided for reference, research or recordkeeping purposes. It is not subject to the Government of Canada Web Standards and has not been altered or updated since it was archived. Please "contact us" to request a format other than those available.

Thanks largely to the money earned from resources, Canada defied the conventional wisdom and was able to overcome several obstacles to steady economic growth, according to a study released today in the Canadian Economic Observer. These hurdles included the slowing US economy and the credit squeeze in global financial markets.
Events in the real economy played out against the backdrop of continued rapid shifts in prices in some markets. The Canadian dollar continued its five-year ascent to reach parity with the US greenback by the end of 2007.
The loonie began to take off late in 2002, just as commodity prices started their historic climb. This price boom began initially in energy, before soon spreading to metals. The largest increases in 2007 were for agricultural products.
Meanwhile, prices in global financial markets were exceptionally volatile throughout the year. Last year's global financial turmoil joined a long list of crises from the past decade. The economy has shown its ability to absorb and adapt to most of these shocks in financial markets.
While many prices in commodity and financial markets were gyrating more than ever, growth in the real economy of output and employment has never been more steady. In the last four years, real gross domestic product (GDP) expanded by 3.1%, 3.1%, 2.8% and 2.7%: easily the most stable growth for any four-year period on record back to 1961.
Canada surpasses US growth
Real GDP growth of 2.7% in Canada was barely affected by the slowdown in the United States, where GDP growth eased from 2.9% in 2006 to 2.2% last year. This was the first year growth in Canada surpassed the United States since early this decade.
It is worth recalling how large the gap between growth in Canada and the United States can be when the latter falters: in 2001, Canada's GDP growth of 1.8% was almost triple the 0.7% in the recession-plagued United States, while the 2.9% increase in 2002 was nearly double the 1.6% gain in the United States. The widely-held myth that "Canada catches cold when the United States sneezes" was debunked years ago: so far in 2007 and 2008, we have barely sniffled while contagion spread in US housing and financial markets.

Canada's steady growth last year, despite the slowdown in the United States, sheds some light on the recent debate about how much Canada can "decouple" from the US economy. To date, the slowdown in the United States has been largely confined to housing and autos, both of which contracted for a second straight year, and of course the financial sector.
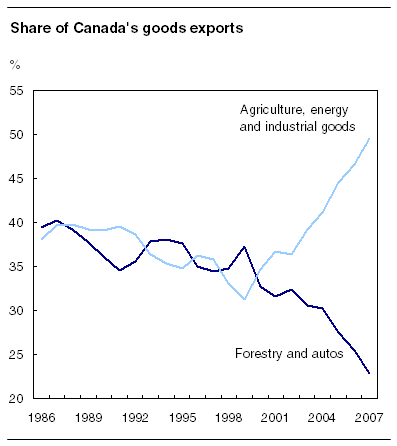
As a result, while Canada's export earnings from forestry and auto products tumbled by 13% and 6% respectively, total exports continued to grow modestly for the fourth year in a row. Consequently, the share of forestry and autos in Canada's total exports hit a record low of 22.9%, compared with their peak of 40.2% in 1987. Value-added exports of autos and forestry account for only 4.1% of GDP.
The overall gain in our exports in 2007 was driven by commodities, notably industrial goods, agriculture and energy, which accounted for exactly half of exports last year. Prices for these goods remained buoyant on world markets, as rising demand from emerging nations more than offset the weakness in the United States.
Canadian exporters were quick to shift away from the slumping US market; while exports to the United States fell 2% in each of the last two years, shipments overseas rose 13% in 2006 and 16% in 2007.
Commodity output slow to respond to high prices
Profits, investment, exports and sales of resources all soared in recent years, but output and employment in the primary sector grew at only about the same rate as the overall economy. This gap reflects how the commodity boom was largely a price phenomenon.
Since 2002, the volume of output in the resource sector rose just 11%, less than the 14% growth for the overall economy. Meanwhile, employment in resources rose 13.6%, implying a drop in output per employee.
The gap between employment and output growth was driven by mining, where jobs jumped 25% between 2002 and 2007 but production rose only 9%.
Manufacturing restructures
Manufacturing sales by industry in 2007 showed almost exactly the same pattern of increase or decrease as seen on balance since 2002. Clothing, forestry products and autos all continued to post large declines, while small drops were seen for printing, beverages and tobacco, rubber and plastic, and computers and electronics.
These losses were offset by rapid growth for petroleum, primary metals, aerospace, machinery, metal fabricating, non-metallic minerals and chemicals. Food, furniture and miscellaneous manufacturers contributed modest gains.
Since 2003, shipments in the 10 expanding industries have jumped 32%, while in the 9 contracting industries they have fallen 14%. The persistence of these sectoral patterns of growth over a five-year period strongly suggests that they represent how manufacturing will emerge from its re-structuring in response to the higher Canadian dollar.
Household spending accelerates
The growing wealth of Canadians was reflected in a 4.7% gain in the volume of consumer spending in 2007, its largest annual increase since 1985.
Flat-screen TVs continued to fly off the shelves of retailers. Auto sales set a new record of 1.686 million units. Despite high gasoline prices, sales of trucks rose while passenger cars fell slightly, lifting the share of trucks in all vehicle sales to a record 49.2%. This helped boost gasoline consumption a further 3.6% last year, despite record high prices at the pump.
Another measure of the growing purchasing power of Canadians was a sharp increase in travel abroad, especially to overseas vacation destinations rather than short shopping trips to the United States: travel overseas rose 9.8%, while trips to the United States were up 6.1%, including a 3.3% increase in same-day auto trips.
Regional differences continues to narrow
It has become commonplace in recent years to characterize Canada as divided between a booming resource economy in the West and a slumping manufacturing sector in the East. In 2007, this was more a falsification than a simplification.
Regional differences in job growth were less pronounced than in recent years. For the first time since 2004, every province posted higher employment. While Alberta continued to lead with a 4.7% gain, growth accelerated in every other province.
The unemployment rate fell to a record low in all three regions, at 6.7% in Central Canada, 4.0% in the West and 9.2% in the Atlantic region.
British Columbia, Quebec and New Brunswick all posted their lowest unemployment rates on record back to 1976, while Newfoundland and Labrador, Nova Scotia, Manitoba and Alberta were all within a whisker (0.2 percentage points or less) of their all-time lows.
Another measure of the tightening of labour market conditions across the country was a drop in the duration of unemployment in every province except Nova Scotia. The average spell of unemployment in Canada fell to 14.0 weeks last year, its lowest since 1976.
Ontario posted the largest decrease in unemployment spells. While manufacturing job losses multiplied in Ontario, these workers evidently either found jobs in other industries or moved elsewhere to find work. This is in marked contrast with sharp increases in unemployment spells during previous slumps in Ontario's manufacturing sector in the early 1980s and early 1990s.
Definitions, data sources and methods: survey numbers, including related surveys, 1302, 1806, 1901, 2202, 2301 and 3701.
The study, "Turbulent stability: Canada's economy in 2007", is included in the April 2008 Internet edition of Canadian Economic Observer, Vol. 21, no. 4 (11-010-XWB, free), now available from the Publications module of our website. The monthly paper version of Canadian Economic Observer, Vol. 21, no. 4 (11-010-XPB, $25/$243), will be available on April 17.
For more information about the Canadian Economic Observer, click on our banner ad from the Publications module of our website.
For more information, or to enquire about the concepts, methods or data quality of this release, contact Philip Cross (613-951-9162; ceo@statcan.gc.ca), Current Economic Analysis Division.