
Statistics Canada
www.statcan.gc.ca
Common menu bar links
Wholesale trade

Archived Content
Information identified as archived is provided for reference, research or recordkeeping purposes. It is not subject to the Government of Canada Web Standards and has not been altered or updated since it was archived. Please "contact us" to request a format other than those available.

Wholesale sales rose 2.3% in July to $46.2 billion as increases across a number of sectors contributed to a fifth consecutive monthly gain. Price effects were minimal in July, as sales in volume terms rose 2.2%.
July's gains were spread across six of the seven wholesale sectors, with food, beverages and tobacco products the only sector reporting lower sales.
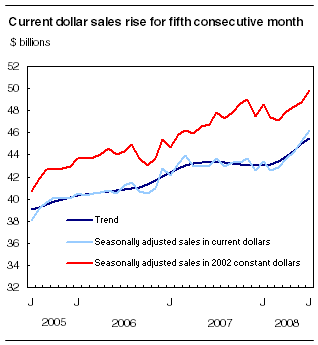
The largest contribution came from the "other products" sector, which rebounded from a 3.4% drop in June to post a 6.0% rise in July. Sales in this sector have increased significantly over the past year, mostly as a result of higher global demand for agricultural supplies. Exports of fertilizers and fertilizer material rose by more than 30% in July and have more than doubled over the past year.
The building materials sector also made a significant contribution (+4.8%) to July's increase, as all three components of this sector reported higher sales. Wholesalers of metal products registered the largest increase, gaining 10.8% in July after a 7.9% rise in June. The value of metal products sales has risen sharply since the end of 2007, mostly due to higher world prices.
The other increase (+3.1%) of note was observed in the machinery and electronic equipment sector and was largely the result of higher sales (+5.1%) in the machinery and equipment trade group, which accounts for half of all sales in this sector. This was the seventh consecutive rise for this trade group, which in recent months has benefited from strong demand for agricultural machinery as well as sales to the oil and gas sector.
Most provinces show gains
Overall, six provinces reported higher sales in July.
Saskatchewan registered another double-digit rise (+10.4%) in July, its third of the year. Sales in July were over 60% higher than in the same month of 2007, in large part due to higher international demand for agricultural products such as fertilizers.
Ontario registered its sixth increase (+2.6%) of the year after a 3.7% gain last month. Higher sales in the automotive products sector were a major factor behind the rise, with the machinery and electronic equipment and building materials sectors also contributing to the increase. Despite these recent rises, the province's sales in the first seven months of the year were slightly lower than in the same period in 2007.
After registering their first decline of the year in June, sales in Alberta increased 2.6% in July, largely as a result of higher sales in the machinery and electronic equipment sector.
Note to readersWholesale sales in real terms are calculated by deflating current dollar values using import and industry product price indexes. Since many of the goods sold by wholesalers are imported, fluctuations in the value of the Canadian dollar can lead to differences between the levels and growth rates when compared with similar estimates presented in current dollars. The wholesale sales series in chained (2002) dollars is a chained Fisher volume index with 2002 as the reference year. |
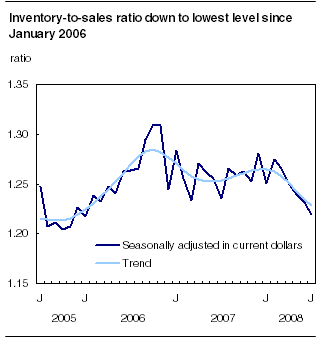
Inventory levels continue to rise
Inventories rose (+1.2%) for a fifth consecutive month in July.
Overall, 11 of the 15 trade groups reported higher inventory levels in July. The motor vehicle and "other products" groups accounted for around half of the rise.
With the growth in sales outpacing the rise in inventories, the inventory-to-sales ratio continued the gradual decline observed over the previous four months, decreasing from 1.23 in June to 1.22 in July. The ratio now sits at its lowest level since January 2006.
Available on CANSIM: tables 081-0007 to 081-0010.
Definitions, data sources and methods: survey number 2401.
The July 2008 issue of Wholesale Trade (63-008-XWE, free) will soon be available.
Wholesale trade estimates for August will be released on October 20.
To obtain data or more information, contact Client Services (toll-free 1-877-421-3067; 613-951-3549; wholesaleinfo@statcan.gc.ca). To enquire about the concepts, methods or data quality of this release, contact Marc Atkins (613-951-0291; marc.atkins@statcan.gc.ca), Distributive Trades Division.
 Table(s).