
Statistics Canada
www.statcan.gc.ca
Common menu bar links
Labour Force Survey

Archived Content
Information identified as archived is provided for reference, research or recordkeeping purposes. It is not subject to the Government of Canada Web Standards and has not been altered or updated since it was archived. Please "contact us" to request a format other than those available.

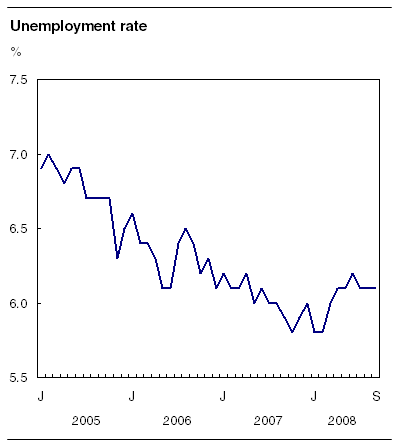
Following a decline in July and a small gain in August, employment increased by 107,000 in September. Almost all of this increase was in part-time work (+97,000). Despite the gain, the unemployment rate was unchanged at 6.1%, as the increase in employment was matched by a similar rise in labour force participation.
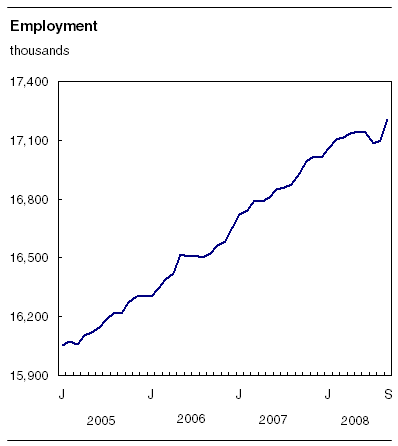
Over the first nine months of 2008, employment has increased 1.1% (+194,000), a slower pace of growth compared with 1.7% (+275,000) during the same period last year. With September's increase, part-time work has increased by 131,000 so far in 2008, nearly double the increase in full time. This contrasts with the first nine months of last year, when gains were mostly full time.
Five provinces accounted for the overall employment increase this September: Ontario, Quebec, Alberta, Saskatchewan and Nova Scotia.
There were widespread gains by industry in September. The largest increase in employment came from health care and social assistance, followed by business, building and other support services, and manufacturing. Employment also increased in transportation and warehousing, agriculture and construction.
The number of private sector employees rose by 56,000 in September, with smaller gains in the self-employed (+30,000) and the public sector (+21,000). So far in 2008, employment has grown mainly among private sector employees.
Youths aged 15 to 24, people aged 55 and over and core-aged women aged 25 to 54 all experienced employment gains in September. Employment rose by 45,000 among youths, while it was up by 41,000 for older workers and by 24,000 for core-aged women.
The year-over-year growth in average hourly wages for September was 4.6%, well above the most recent increase of 3.5% in the Consumer Price Index. Compared with a year earlier, average hourly wages were higher for all age groups, with growth being strongest for youths and older workers.
Note to readersPlease note that Table 1 in the publication Labour Force Information has been extended to include labour force characteristics for men and women aged 25 to 54 years and 55 years and over at the Canada level. The Labour Force Survey (LFS) estimates are based on a sample, and are therefore subject to sampling variability. Estimates for smaller geographic areas or industries will have more variability. For an explanation of sampling variability of estimates, and how to use standard errors to assess this variability, consult the "Data quality" section of the publication Labour Force Information (71-001-XWE, free). |
Over the first nine months of this year, the labour market in Canada has followed a trend different from that of the United States. So far in 2008, employment in Canada has been growing, albeit at a slower pace compared with last year, while in the United States employment has fallen. When adjusted to approximate United States measurement concepts, the unemployment rate in Canada has remained relatively stable at around 5.3% so far this year, while in the United States, it has risen by 1.1 percentage points to 6.1%.
Employment up across many industries
Employment in health care and social assistance rose by 40,000 in September, erasing losses observed over the previous three months. This leaves employment in the industry 2.8% above the level at the end of last year.
In September, employment was up by 20,000 in business, building and other support services. Despite the latest increase, employment in the industry remained 5.1% lower than the level observed at the end of last year.
Manufacturing employment increased by 20,000 in September, bringing the industry back to a level similar to the end of 2007. So far this year, continued weakness in this sector in Ontario was offset by gains in Quebec and Alberta. Compared with the peak reached in 2002, manufacturing employment in Canada is down 342,000.
In September, employment increased by 17,000 in "other services." Employment also rose by 16,000 in transportation and warehousing, with gains mostly in trucking and rail transportation.
In September, employment increased by 15,000 in agriculture, with gains in Ontario, Alberta and Saskatchewan. According to the September Farm Survey, farmers expect a large harvest of field crops such as canola and wheat. Despite this latest employment gain, farm employment has declined by 6.0% (-21,000) over the past 12 months.
Employment in the construction industry continued to build on the strength observed over the past few years, up 14,000 in September. This brings total gains since the start of the year to 101,000 (+8.7%), the largest increase of any industry, with gains mostly in Ontario, British Columbia, Quebec and Alberta.
Employment in natural resources edged up 6,700 in September with nearly all of the gain in Alberta. September's increase came from the oil and gas sector, which accounted for about half of the 0.7% increase in real gross domestic product in July.
There were employment declines in accommodation and food services (-16,000) and utilities (-9,300) in September. Despite these decreases, employment in both industries has shown an upward trend over the first nine months of the year.
Strong employment growth in Central Canada
Employment in Ontario rose by 52,000 in September, bringing growth so far in 2008 to 1.6%. Despite these gains, the unemployment rate edged up to 6.4%, as a large number of people entered the labour market. So far this year, employment increases have occurred in transportation and warehousing; construction; accommodation and food services; and health care and social assistance, while there has been a decline in manufacturing (-16,000).
In Quebec, employment increased by 32,000 in September, pushing the unemployment rate down 0.4 percentage points to 7.3%. Over the first nine months of this year, there has been little employment change, as gains in health care and social assistance; manufacturing; construction; and information, culture and recreation were dampened by declines in retail and wholesale trade; agriculture and "other services."
Employment in Alberta rose by 17,000 in September, bringing total gains so far this year to 30,000 (+1.5%), or about half the increase observed over the same period in 2007. Employment gains in 2008 have occurred in professional, scientific and technical services; manufacturing; educational services; agriculture; and construction. In September, a large increase in labour force participation pushed the unemployment rate up 0.3 percentage points to 3.8%, still the lowest in the country.
In Saskatchewan, employment was up by 7,700 in September, an increase similar to that of the month before. The unemployment rate fell 0.4 percentage points to 4.1%. So far this year, employment has grown by 2.9%, the fastest rate of growth of any province. Increases over this period occurred mainly in construction; health care and social assistance; and natural resources.
Employment also increased in Nova Scotia in September, up 4,900, bringing the employment rate back to its record high of 59.3%.
In Newfoundland and Labrador, employment edged down 2,700 in September, leaving employment in the province down slightly from the level at the end of 2007.
Quarterly update on the territories
The Labour Force Survey also collects labour market information about the territories. This information is not seasonally adjusted and is produced monthly in the form of three-month moving averages. Comparisons should only be made on a year-over-year basis.
Yukon experienced a robust labour market in the third quarter of 2008, with the highest employment rate in the country at 73.5%, up 1.7 percentage points from the same quarter last year. Over the same period, its unemployment rate was among the lowest in the country at 4.4%, down 0.7 percentage points from a year earlier.
Both the Northwest Territories and Nunavut saw declines in their employment rates in the third quarter of 2008 compared with the same quarter in 2007.
In the Northwest Territories, the employment rate fell 2.8 percentage points over the period to 72.1%. Despite this decline, the employment rate remained among the highest in Canada. At the same time, the unemployment rate edged down 0.7 percentage points to 5.0%, the result of a decline in labour force participation.
In the 10 largest communities of Nunavut, employment fell between the third quarters of 2007 and 2008, bringing the employment rate down 3.5 percentage points to 60.5%. Over the same period, the unemployment rate increased to 13.5% in the third quarter of 2008 from 8.3% a year earlier.
Available on CANSIM: tables 282-0001 to 282-0042, 282-0047 to 282-0064 and 282-0069 to 282-0099.
Definitions, data sources and methods: survey number 3701.
A more detailed summary, Labour Force Information (71-001-XWE, free) is now available online for the week ending September 20. From the Publications module of our website, under Free Internet publications, choose Labour. LAN and bulk prices are available on request. The CD-ROM Labour Force Historical Review, 2007 (71F0004XCB, $209), is now available.
Data tables are also now available online. From the By subject module of our website, choose Labour.
The next release of the Labour Force Survey will be on November 7.
For more information, or to order data, contact Client Services (toll-free 1-866-873-8788; 613-951-4090; labour@statcan.gc.ca). To enquire about the concepts, methods or data quality of this release, contact, Jason Gilmore (613-951-7118; jason.gilmore@statcan.gc.ca), or Vincent Ferrao (613-951-4750; vincent.ferrao@statcan.gc.ca), Labour Statistics Division.
 Table(s).