
Statistics Canada
www.statcan.gc.ca
Common menu bar links
New Housing Price Index

Archived Content
Information identified as archived is provided for reference, research or recordkeeping purposes. It is not subject to the Government of Canada Web Standards and has not been altered or updated since it was archived. Please "contact us" to request a format other than those available.
Contractors' selling prices decreased 0.6% between December and January, a slightly faster pace than the 0.1% decline observed the previous month. This resulted in a New Housing Price Index of 156.4 (1997=100).
Between December and January, prices declined 2.8% in Edmonton, followed by Calgary (-2.1%), Victoria (-1.1%) and Vancouver (-0.7%). Builders in all four cities report difficult market conditions.
In Saint John, Fredericton and Moncton, new housing prices increased 1.4% from a month earlier, as builders increased their list price or returned to list price after reporting lower negotiated prices in previous months.
In both St. John's and Saskatoon, prices increased 0.8% from a month earlier while Québec posted a monthly increase of 0.6%.
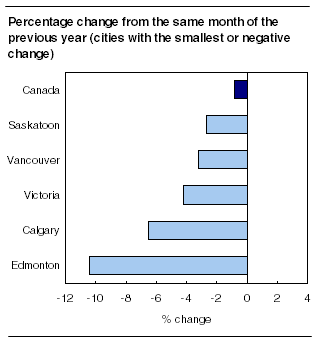
The New Housing Price Index decreased by 0.8% in January compared with the same month a year earlier. This was the first year-over-year decrease at the Canada level since January 1997.
In the Prairie region, 12-month declines were recorded in Edmonton (-10.4%), Calgary (-6.5%) and Saskatoon (-2.7%).
On the West Coast, Victoria (-4.2%) and Vancouver (-3.2%) each posted year-over-year declines.
Chart 1
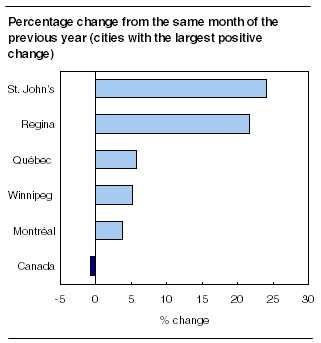
Among surveyed cities, the largest year-over-year increase was registered in St. John's at 24.1%, followed by Regina at 21.7%.
In Québec, the 12-month growth rate was 5.7%, while in Montréal prices increased 3.8%.
Compared with January 2008, contractors' selling prices were 5.2% higher in Winnipeg, and 3.3% higher in Ottawa–Gatineau.
Chart 2
Available on CANSIM: table 327-0005.
Definitions, data sources and methods: survey number 2310.
The fourth quarter 2008 issue of Capital Expenditure Price Statistics (62-007-XWE, free) will be available in April.
For more information, or to enquire about the concepts, methods or data quality of this release, contact Client Services (613-951-9606; toll-free 1-866-230-2248; fax: 613-951-3117; prices-prix@statcan.gc.ca), Prices Division.
Table 1
| January 2009 | January 2008 to January 2009 | December 2008 to January 2009 | |
|---|---|---|---|
| 1997=100 | % change | ||
| Canada total | 156.4 | -0.8 | -0.6 |
| House only | 164.4 | -1.9 | -0.7 |
| Land only | 140.2 | 1.7 | -0.6 |
| St. John's | 179.1 | 24.1 | 0.8 |
| Halifax | 150.4 | 2.7 | 0.1 |
| Charlottetown | 119.6 | -0.8 | 0.2 |
| Saint John, Fredericton and Moncton | 119.9 | 3.5 | 1.4 |
| Québec | 160.4 | 5.7 | 0.6 |
| Montréal | 163.9 | 3.8 | 0.1 |
| Ottawa–Gatineau | 169.6 | 3.3 | 0.0 |
| Toronto and Oshawa | 146.5 | 1.1 | 0.1 |
| Hamilton | 152.3 | 1.1 | -0.1 |
| St. Catharines–Niagara | 155.9 | 2.4 | 0.2 |
| Kitchener | 143.2 | 1.3 | 0.0 |
| London | 143.3 | 2.1 | 0.0 |
| Windsor | 103.7 | 0.4 | 0.0 |
| Greater Sudbury and Thunder Bay | 112.7 | 3.2 | 0.0 |
| Winnipeg | 181.4 | 5.2 | 0.0 |
| Regina | 248.7 | 21.7 | 0.0 |
| Saskatoon | 219.8 | -2.7 | 0.8 |
| Calgary | 235.7 | -6.5 | -2.1 |
| Edmonton | 222.3 | -10.4 | -2.8 |
| Vancouver | 119.7 | -3.2 | -0.7 |
| Victoria | 114.3 | -4.2 | -1.1 |