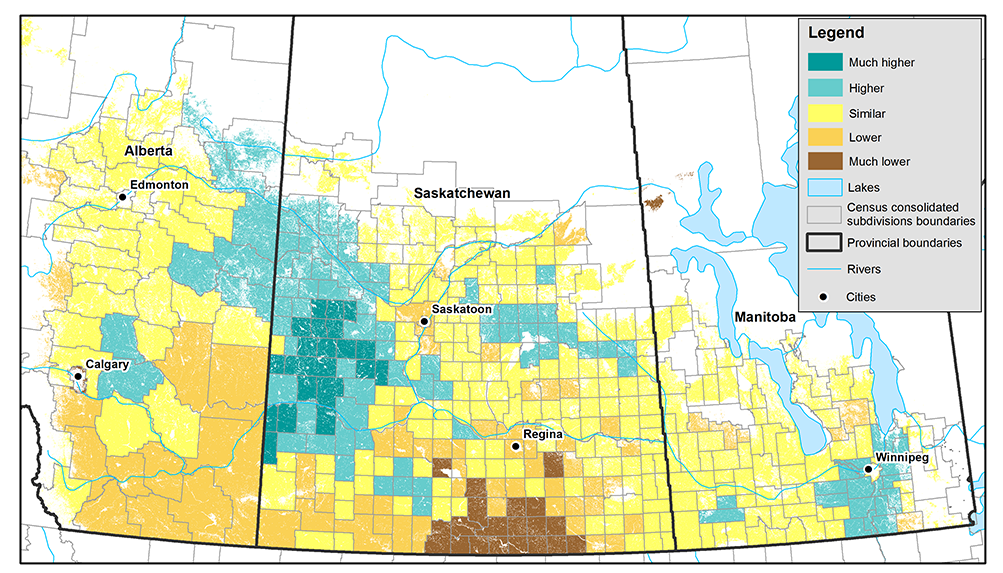
Map 1
Vegetation growth index as of July 24 to 30, 2017 (during survey collection), compared with the last 30-year avearage, by census consolidated subdivisions

Map description
The title of the map is "Vegetation growth index as of July 24 to 30, 2017 (during survey collection), compared with the last 30-year avearage, by census consolidated subdivisions"
This map shows the very dry weather conditions that prevailed during July 24 to 30, 2017 period, which period coincided with survey collection. The very dry conditions can be seen in the southern portion of the Prairies.
- Date modified: