
Statement outlining results, risks and significant changes in operations, personnel and program
A) Introduction
Statistics Canada's mandate
Statistics Canada ("the agency") is a member of the Innovation, Science and Economic Development portfolio.
Statistics Canada's role is to ensure that Canadians have access to a trusted source of statistics on Canada that meets their highest priority needs.
The agency's mandate derives primarily from the Statistics Act. The Act requires that the agency collects, compiles, analyzes and publishes statistical information on the economic, social, and general conditions of the country and its people. It also requires that Statistics Canada conduct the census of population and the census of agriculture every fifth year, and protects the confidentiality of the information with which it is entrusted.
Statistics Canada also has a mandate to co-ordinate and lead the national statistical system. The agency is considered a leader, among statistical agencies around the world, in co‑ordinating statistical activities to reduce duplication and reporting burden.
More information on Statistics Canada's mandate, roles, responsibilities and programs can be found in the 2017–2018 Main Estimates and in the Statistics Canada 2017–2018 Departmental Plan.
The quarterly financial report:
- should be read in conjunction with the 2017–2018 Main Estimates;
- has been prepared by management, as required by Section 65.1 of the Financial Administration Act, and in the form and manner prescribed by Treasury Board;
- has not been subject to an external audit or review.
Statistics Canada has the authority to collect and spend revenue from other federal government departments and agencies, as well as from external clients, for statistical services and products.
Basis of presentation
This quarterly report has been prepared by management using an expenditure basis of accounting. The accompanying Statement of Authorities includes the agency's spending authorities granted by Parliament and those used by the agency consistent with the Main Estimates for the 2017–2018 fiscal year. This quarterly report has been prepared using a special purpose financial reporting framework designed to meet financial information needs with respect to the use of spending authorities.
The authority of Parliament is required before moneys can be spent by the Government. Approvals are given in the form of annually approved limits through appropriation acts or through legislation in the form of statutory spending authority for specific purposes.
The agency uses the full accrual method of accounting to prepare and present its annual departmental financial statements that are part of the departmental results reporting process. However, the spending authorities voted by Parliament remain on an expenditure basis.
B) Highlights of fiscal quarter and fiscal year-to-date results
This section highlights the significant items that contributed to the net decrease in resources available for the year, as well as actual expenditures for the quarter ended September 30.
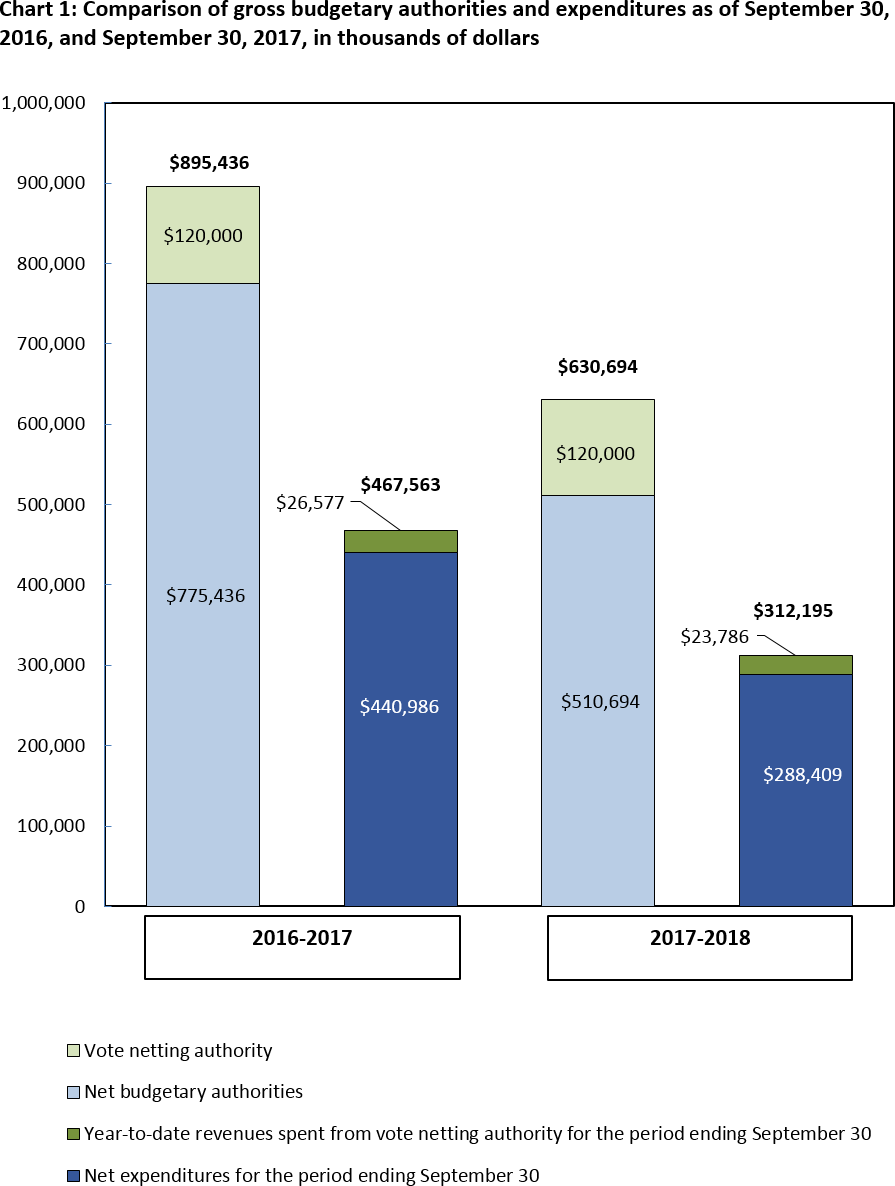
Description for Chart 1: Comparison of gross budgetary authorities and expenditures as of September 30, 2016, and September 30, 2017, in thousands of dollars
This bar graph shows Statistics Canada's budgetary authorities and expenditures, in thousands of dollars, as of September 30, 2016 and 2017:
- As at September 30, 2016
- Net budgetary authorities: $775,436
- Vote netting authority: $120,000
- Total authority: $895,436
- Net expenditures for the period ending September 30: $440,986
- Year-to-date revenues spent from vote netting authority for the period ending September 30: $26,577
- Total expenditures: $467,563
- As at September 30, 2017
- Net budgetary authorities: $510,694
- Vote netting authority: $120,000
- Total authority: $630,694
- Net expenditures for the period ending September 30: $288,409
- Year-to-date revenues spent from vote netting authority for the period ending September 30: $23,786
- Total expenditures: $312,195
Chart 1 outlines the gross budgetary authorities, which represent the resources available for use for the year as of September 30.
Significant changes to authorities
Total authorities available for 2017–2018 have decreased by $264.7 million, or 29.6%, from the previous year, from $895.4 million to $630.7 million (Chart 1).
This net decrease was mostly the result of the following:
- Decrease for the Census of Population program ($310.0 million), as well as for the Census of Agriculture program ($12.1 million) due to the cyclical nature of funding winding down in 2017–2018;
- Increase for the Statistical Survey Operations pay equity settlement ($32.4 million);
- Increase in the value of the carry forward by $15.7 million.
In addition to the appropriations allocated to the agency through the Main Estimates, Statistics Canada also has vote net authority within Vote 1, which entitles the agency to spend revenues collected from other federal government departments, agencies, and external clients to provide statistical services. Vote netting authority is stable at $120 million in each of the fiscal years 2016–2017 and 2017–2018.
Significant changes to expenditures
Year-to-date net expenditures recorded to the end of the second quarter decreased by $152.6 million, or 34.6% from the previous year, from $441.0 million to $288.4 million (See Table A: Variation in Departmental Expenditures by Standard Object).
Most of the decrease in spending is due to the 2016 Census of Population program. Statistics Canada spent approximately 56.5% of its authorities by the end of the second quarter, compared with 56.9% in the same quarter of 2016–2017.
| Departmental Expenditures Variation by Standard Object | Q2 year-to-date variation between fiscal year 2016–2017 and 2017–2018 | |
|---|---|---|
| $'000 | % | |
| (01) Personnel | 5,393 | 2.0 |
| (02) Transportation and communications | -48,919 | -87.8 |
| (03) Information | -6,248 | -73.7 |
| (04) Professional and special services | -106,427 | -93.0 |
| (05) Rentals | -613 | -7.0 |
| (06) Repair and maintenance | -274 | -71.7 |
| (07) Utilities, materials and supplies | -629 | -57.0 |
| (08) Acquisition of land, buildings and works | 45 | - |
| (09) Acquisition of machinery and equipment | 1,352 | 65.3 |
| (10) Transfer payments | -100 | -100.0 |
| (12) Other subsidies and payments | 1,052 | 6,577.3 |
| Total gross budgetary expenditures | -155,368 | -33.2 |
| Less revenues netted against expenditures | ||
| Revenues | -2,791 | -10.5 |
| Total net budgetary expenditures | -152,577 | -34.6 |
| Note: Explanations are provided for variances of more than $1 million. | ||
The 2016 Census of Population reached the peak of its cyclical expenditures in 2016–2017, spending in 2017–2018 drops sharply as activities wound down.
01) Personnel: The increase is mainly due to the retroactive salary payments of signed collective agreements. This increase is partly offset by the decrease in expenditures of public servants whom were hired in 2016–2017 to conduct census-related activities.
02) Transportation and communications: The decrease is mainly due to reduced costs in postage and travel in 2016–2017 for census related activities.
03) Information: The decrease is mainly due to the printing of census material and the implementation of the census media plan in 2016–2017.
04) Professional and special services: The decrease is mainly due to the end of census collection and processing activities, which employed approximately 35,000 temporary staff in 2016–2017.
09) Acquisition of machinery and equipment: The increase is due to the purchase of new software licenses.
12) Other subsidies and payments: The increase is mainly due to the set-up of the salary overpayments resulting from Phoenix issues.
Revenues: The decrease is primarily the result of timing differences in the receipt of funds for scheduled key deliverables and of a change in presentation method.
C) Risks and uncertainties
Statistics Canada uses a risk-based decision-making process to conduct its business. In order to do so effectively, the agency identifies key corporate risks and develops corresponding mitigation strategies within its Corporate Risk Profile on an annual basis. At this point in time, none of the agency's key corporate risks involve significant financial risks.
D) Significant changes to operations, personnel and programs
In 2017–2018, Statistics Canada will continue the processing and analysis of Census program data, and dissemination of the remaining major 2016 census data releases. This year, six releases are planned. For the Census of Population, three releases took place so far (May, August and September) and the others are scheduled in October and November 2017. Regarding the Census of Agriculture, the release took place in May. This contrasts with last year, when Statistics Canada focused on data collection and processing activities of the 2016 Census program.
Since the start of the fiscal year, many of the agency's collective agreements were signed following negotiations between the unions and Treasury Board. As such, during the second quarter, Statistics Canada processed a significant number of retroactive payments to employees, increasing the agency's salary expenditures on a one-time basis. Further, employees' salaries were adjusted upwards as per the new agreements which will result in a higher overall salary for third quarter and going forward.
Approval by senior officials
The original version was signed by
Anil Arora, Chief Statistician
Monia Lahaie, Acting Chief Financial Officer
Ottawa, Ontario
Date signed: November 22, 2017
Appendix
| Total available for use for the year ending March 31, 2018Table footnote 1 | Used during the quarter ended September 30, 2017 | Year-to-date used at quarter-end | |
|---|---|---|---|
| in thousands of dollars | |||
| Vote 1 — Net operating expenditures | 445,202 | 149,839 | 255,663 |
| Statutory authority — Contribution to employee benefit plans | 65,492 | 16,373 | 32,746 |
| Total budgetary authorities | 510,694 | 166,212 | 288,409 |
|
|||
| Total available for use for the year ending March 31, 2017Table footnote 1 | Used during the quarter ended September 30, 2016 | Year-to-date used at quarter-end | |
|---|---|---|---|
| in thousands of dollars | |||
| Vote 1 — Net operating expenditures | 696,599 | 182,866 | 401,567 |
| Statutory authority — Contribution to employee benefit plans | 78,837 | 19,710 | 39,419 |
| Total budgetary authorities | 775,436 | 202,576 | 440,986 |
|
|||
| Planned expenditures for the year ending March 31, 2018 | Expended during the quarter ended September 30, 2017 | Year-to-date used at quarter-end | |
|---|---|---|---|
| in thousands of dollars | |||
| Expenditures: | |||
| (01) Personnel | 482,636 | 156,013 | 281,941 |
| (02) Transportation and communications | 22,158 | 3,341 | 6,782 |
| (03) Information | 4,756 | 1,344 | 2,224 |
| (04) Professional and special services | 43,366 | 4,716 | 7,957 |
| (05) Rentals | 16,803 | 4,743 | 8,172 |
| (06) Repair and maintenance | 2,777 | 54 | 108 |
| (07) Utilities, materials and supplies | 3,832 | 216 | 474 |
| (08) Acquisition of land, buildings and works | - | 42 | 45 |
| (09) Acquisition of machinery and equipment | 11,160 | 1,364 | 3,424 |
| (10) Transfer payments | 100 | - | - |
| (12) Other subsidies and payments | 43,106 | 947 | 1,068 |
| Total gross budgetary expenditures | 630,694 | 172,780 | 312,195 |
| Less revenues netted against expenditures: | |||
| Revenues | 120,000 | 6,568 | 23,786 |
| Total revenues netted against expenditures | 120,000 | 6,568 | 23,786 |
| Total net budgetary expenditures | 510,694 | 166,212 | 288,409 |
| Planned expenditures for the year ending March 31, 2017 | Expended during the quarter ended September 30, 2016 | Year-to-date used at quarter-end | |
|---|---|---|---|
| in thousands of dollars | |||
| Expenditures: | |||
| (01) Personnel | 537,192 | 136,949 | 276,548 |
| (02) Transportation and communications | 91,882 | 32,542 | 55,701 |
| (03) Information | 13,896 | 4,755 | 8,472 |
| (04) Professional and special services | 209,409 | 35,966 | 114,384 |
| (05) Rentals | 21,315 | 4,462 | 8,785 |
| (06) Repair and maintenance | 5,730 | 239 | 382 |
| (07) Utilities, materials and supplies | 6,408 | 609 | 1,103 |
| (08) Acquisition of land, buildings and works | - | - | - |
| (09) Acquisition of machinery and equipment | 9,342 | 1,047 | 2,072 |
| (10) Transfer payments | 207 | - | 100 |
| (12) Other subsidies and payments | 55 | 11 | 16 |
| Total gross budgetary expenditures | 895,436 | 216,580 | 467,563 |
| Less revenues netted against expenditures: | |||
| Revenues | 120,000 | 14,004 | 26,577 |
| Total revenues netted against expenditures | 120,000 | 14,004 | 26,577 |
| Total net budgetary expenditures | 775,436 | 202,576 | 440,986 |