
Statement outlining results, risks and significant changes in operations, personnel and program
A) Introduction
Statistics Canada's mandate
Statistics Canada ("the agency") is a member of the Innovation, Science and Economic Development portfolio.
Statistics Canada's role is to ensure that Canadians have access to a trusted source of statistics on Canada that meets their highest priority needs.
The agency's mandate derives primarily from the Statistics Act. The Act requires that the agency collects, compiles, analyzes and publishes statistical information on the economic, social, and general conditions of the country and its people. It also requires that Statistics Canada conduct the census of population and the census of agriculture every fifth year, and protects the confidentiality of the information with which it is entrusted.
Statistics Canada also has a mandate to co-ordinate and lead the national statistical system. The agency is considered a leader, among statistical agencies around the world, in co–ordinating statistical activities to reduce duplication and reporting burden.
More information on Statistics Canada's mandate, roles, responsibilities and programs can be found in the 2019–2020 Main Estimates and in the Statistics Canada 2019–2020 Departmental Plan.
The Quarterly Financial Report:
- should be read in conjunction with the 2019–2020 Main Estimates;
- has been prepared by management, as required by Section 65.1 of the Financial Administration Act, and in the form and manner prescribed by Treasury Board of Canada Secretariat;
- has not been subject to an external audit or review.
Statistics Canada has the authority to collect and spend revenue from other federal government departments and agencies, as well as from external clients, for statistical services and products.
Basis of presentation
This quarterly report has been prepared by management using an expenditure basis of accounting. The accompanying Statement of Authorities includes the agency's spending authorities granted by Parliament and those used by the agency consistent with the Main Estimates for the 2019–2020 fiscal year. This quarterly report has been prepared using a special purpose financial reporting framework designed to meet financial information needs with respect to the use of spending authorities.
The authority of Parliament is required before moneys can be spent by the Government. Approvals are given in the form of annually approved limits through appropriation acts or through legislation in the form of statutory spending authority for specific purposes.
The agency uses the full accrual method of accounting to prepare and present its annual departmental financial statements that are part of the departmental results reporting process. However, the spending authorities voted by Parliament remain on an expenditure basis.
B) Highlights of fiscal quarter and fiscal year-to-date results
This section highlights the significant items that contributed to the net increase in resources available for the year, as well as actual expenditures for the quarter ended June 30.
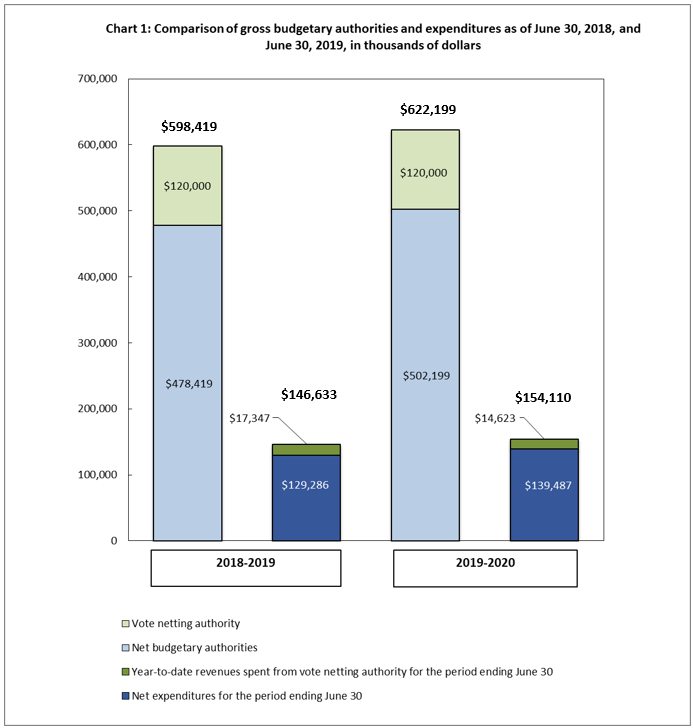
Description for Chart 1: Comparison of gross budgetary authorities and expenditures as of June 30, 2018, and June 30, 2019, in thousands of dollars
This bar graph shows Statistics Canada's budgetary authorities and expenditures, in thousands of dollars, as of June 30, 2018 and 2019:
- As at June 30, 2018
- Net budgetary authorities: $478,419
- Vote netting authority: $120,000
- Total authority: $598,419
- Net expenditures for the period ending June 30: $129,286
- Year-to-date revenues spent from vote netting authority for the period ending June 30: $17,347
- Total expenditures: $146,633
- As at June 30, 2019
- Net budgetary authorities: $502,199
- Vote netting authority: $120,000
- Total authority: $622,199
- Net expenditures for the period ending June 30: $139,487
- Year-to-date revenues spent from vote netting authority for the period ending June 30: $14,623
- Total expenditures: $154,110
Chart 1 outlines the gross budgetary authorities, which represent the resources available for use for the year as of June 30.
Significant changes to authorities
Total authorities available for 2019–2020 have increased by $23.8 million, or 4.0%, from the previous year, from $598.4 million to $622.2 million (Chart 1). This net increase is mostly the result of the following:
- An increase of $22.4 million for the 2021 Census of Population program and $8.4 million for the 2021 Census of Agriculture program for new cyclical funding received to cover planning and developmental activities;
- An increase of $6.3 million for Workload Migration, an initiative approved in 2018–2019 which will migrate the information technology infrastructure to the cloud;
- An increase of $3.2 million for the Survey of Financial Security and Annual Household Wealth Tables;
- An increase of $3.0 million for the Renewing and Modernizing Statistics Canada initiative approved in 2018–2019 which will change the way the federal government collects, uses and shares data while ensuring the privacy of Canadians remains protected;
- A decrease of $6.2 million for the 2016 Census of Population program and $2.2 million for the 2016 Census of Agriculture program due to the cyclical nature of funding that is winding down;
- A decrease of $6.0 million for the finalisation of retro pay for collective agreements;
- A decrease of $5.8 million for the Statistical Survey Operations pay equity settlement.
The variance is also explained by the reception of authorities at different quarters throughout the year.
In addition to the appropriations allocated to the agency through the Main Estimates, Statistics Canada also has vote net authority within Vote 1, which entitles the agency to spend revenues collected from other federal government departments, agencies, and external clients to provide statistical services. The vote netting authority is stable at $120 million when comparing the first quarter of fiscal years 2018–2019 and 2019–2020.
Significant changes to expenditures
Year-to-date net expenditures recorded to the end of the first quarter increased by $10.2 million, or 7.9% from the previous year, from $129.3 million to $139.5 million (see Table A: Variation in Departmental Expenditures by Standard Object).
Statistics Canada spent approximately 28% of its authorities by the end of the first quarter, compared with 27% in the same quarter of 2018–2019.
| Departmental Expenditures Variation by Standard Object: | Q1 year-to-date variation between fiscal year 2018–2019 and 2019–2020 | |
|---|---|---|
| $'000 | % | |
| Note: Explanations are provided for variances of more than $1 million. | ||
| (01) Personnel | 7,819 | 6.0 |
| (02) Transportation and communications | 949 | 40.1 |
| (03) Information | 258 | 27.7 |
| (04) Professional and special services | 598 | 12.1 |
| (05) Rentals | 875 | 19.6 |
| (06) Repair and maintenance | -31 | -24.2 |
| (07) Utilities, materials and supplies | -54 | -28.7 |
| (08) Acquisition of land, buildings and works | -7 | -100.0 |
| (09) Acquisition of machinery and equipment | -2,025 | -71.8 |
| (10) Transfer payments | - | - |
| (12) Other subsidies and payments | -905 | -76.9 |
| Total gross budgetary expenditures | 7,477 | 5.1 |
| Less revenues netted against expenditures: | ||
| Revenues | -2,724 | -15.7 |
| Total net budgetary expenditures | 10,201 | 7.9 |
Personnel: The increase is mainly due to the ratification of collective agreements and an overall increase in the agency's activities.
Acquisition of machinery and equipment: The decrease is mainly due to a temporary variance related to an invoice for which the cost of the service request has been reduced later in the fiscal year.
Revenues: The decrease is primarily the result of timing differences in the receipt of funds for scheduled key deliverables.
The variance is also explained by timing differences of payments in this period compared to last fiscal year.
C) Risks and uncertainties
Statistics Canada is currently expending significant effort in modernizing its business processes and tools, in order to maintain its relevance and maximize the value it provides to Canadians. As a foundation piece for some of these efforts, the agency is working in collaboration with Shared Services Canada and Treasury Board of Canada Secretariat, Office of the Chief Information Officer, to ensure the agency has access to adequate IT services and support to attain its modernization objectives and successfully transition its infrastructure to the cloud. Activities and related costs are projected based on various assumptions that can change, depending on the nature and degree of work required to accomplish the initiatives. Risks and uncertainties are being mitigated by the agency's strong financial planning management practices and business architecture.
D) Significant changes to operations, personnel and programs
There were no major changes to the departmental operations during this quarter. Minor changes in program activities with financial implications include:
- The Census program is ramping down operations from the 2016 Census and is in a more advanced planning and testing phase for the 2021 Census. As such, expenditures for this program are increasing.
- Budget 2018 announced funding for new initiatives. Expenditures related to these new initiatives will ramp up throughout the fiscal year.
Approval by senior officials
Approved by:
Anil Arora, Chief Statistician
Kathleen Mitchell, Acting Chief Financial Officer
Ottawa, Ontario
Signed on: August 21, 2019
Appendix
| Fiscal year 2019–2020 | Fiscal year 2018–2019 | |||||
|---|---|---|---|---|---|---|
| Total available for use for the year ending March 31, 2020Tablenote 1 | Used during the quarter ended June 30, 2019 | Year-to-date used at quarter-end | Total available for use for the year ending March 31, 2019Tablenote 1 | Used during the quarter ended June 30, 2018 | Year-to-date used at quarter-end | |
| in thousands of dollars | ||||||
|
||||||
| Vote 1 — Net operating expenditures | 430,647 | 121,622 | 121,622 | 409,564 | 113,579 | 113,579 |
| Statutory authority — Contribution to employee benefit plans | 71,552 | 17,865 | 17,865 | 68,855 | 15,707 | 15,707 |
| Total budgetary authorities | 502,199 | 139,487 | 139,487 | 478,419 | 129,286 | 129,286 |
| Fiscal year 2019–2020 | Fiscal year 2018–2019 | |||||
|---|---|---|---|---|---|---|
| Planned expenditures for the year ending March 31, 2020 | Expended during the quarter ended June 30, 2019 | Year-to-date used at quarter-end | Planned expenditures for the year ending March 31, 2019 | Expended during the quarter ended June 30, 2018 | Year-to-date used at quarter-end | |
| in thousands of dollars | ||||||
| Expenditures: | ||||||
| (01) Personnel | 540,787 | 137,419 | 137,419 | 512,332 | 129,600 | 129,600 |
| (02) Transportation and communications | 15,413 | 3,318 | 3,318 | 16,557 | 2,369 | 2,369 |
| (03) Information | 7,559 | 1,191 | 1,191 | 7,198 | 933 | 933 |
| (04) Professional and special services | 33,048 | 5,539 | 5,539 | 29,945 | 4,941 | 4,941 |
| (05) Rentals | 10,676 | 5,343 | 5,343 | 12,207 | 4,468 | 4,468 |
| (06) Repair and maintenance | 560 | 97 | 97 | 1,241 | 128 | 128 |
| (07) Utilities, materials and supplies | 1,845 | 134 | 134 | 2,589 | 188 | 188 |
| (08) Acquisition of land, buildings and works | 516 | - | - | 172 | 7 | 7 |
| (09) Acquisition of machinery and equipment | 11,635 | 797 | 797 | 10,419 | 2,822 | 2,822 |
| (10) Transfer payments | 100 | - | - | 100 | - | - |
| (12) Other subsidies and payments | 60 | 272 | 272 | 5,659 | 1,177 | 1,177 |
| Total gross budgetary expenditures | 622,199 | 154,110 | 154,110 | 598,419 | 146,633 | 146,633 |
| Less revenues netted against expenditures: | ||||||
| Revenues | 120,000 | 14,623 | 14,623 | 120,000 | 17,347 | 17,347 |
| Total revenues netted against expenditures | 120,000 | 14,623 | 14,623 | 120,000 | 17,347 | 17,347 |
| Total net budgetary expenditures | 502,199 | 139,487 | 139,487 | 478,419 | 129,286 | 129,286 |