
Statement outlining results, risks and significant changes in operations, personnel and program
A) Introduction
Statistics Canada's mandate
Statistics Canada ("the agency") is a member of the Innovation, Science and Industry portfolio.
Statistics Canada's role is to ensure that Canadians have access to a trusted source of statistics on Canada that meets their highest priority needs.
The agency's mandate derives primarily from the Statistics Act. The Act requires that the agency collects, compiles, analyzes and publishes statistical information on the economic, social, and general conditions of the country and its people. It also requires that Statistics Canada conduct the census of population and the census of agriculture every fifth year and protects the confidentiality of the information with which it is entrusted.
Statistics Canada also has a mandate to co-ordinate and lead the national statistical system. The agency is considered a leader, among statistical agencies around the world, in co–ordinating statistical activities to reduce duplication and reporting burden.
More information on Statistics Canada's mandate, roles, responsibilities and programs can be found in the 2022-2023 Main Estimates and in the Statistics Canada 2022-2023 Departmental Plan.
The Quarterly Financial Report:
- should be read in conjunction with the 2022-2023 Main Estimates;
- has been prepared by management, as required by Section 65.1 of the Financial Administration Act, and in the form and manner prescribed by Treasury Board of Canada Secretariat;
- has not been subject to an external audit or review.
Statistics Canada has the authority to collect and spend revenue from other federal government departments and agencies, as well as from external clients, for statistical services and products.
Basis of presentation
This quarterly report has been prepared by management using an expenditure basis of accounting. The accompanying Statement of Authorities includes the agency's spending authorities granted by Parliament and those used by the agency consistent with the Main Estimates for the 2022-2023 fiscal year. This quarterly report has been prepared using a special purpose financial reporting framework designed to meet financial information needs with respect to the use of spending authorities.
The authority of Parliament is required before moneys can be spent by the Government. Approvals are given in the form of annually approved limits through appropriation acts or through legislation in the form of statutory spending authority for specific purposes.
The agency uses the full accrual method of accounting to prepare and present its annual departmental financial statements that are part of the departmental results reporting process. However, the spending authorities voted by Parliament remain on an expenditure basis.
B) Highlights of fiscal quarter and fiscal year-to-date results
This section highlights the significant items that contributed to the net decrease in resources available for the year, as well as actual expenditures for the quarter ended December 31.
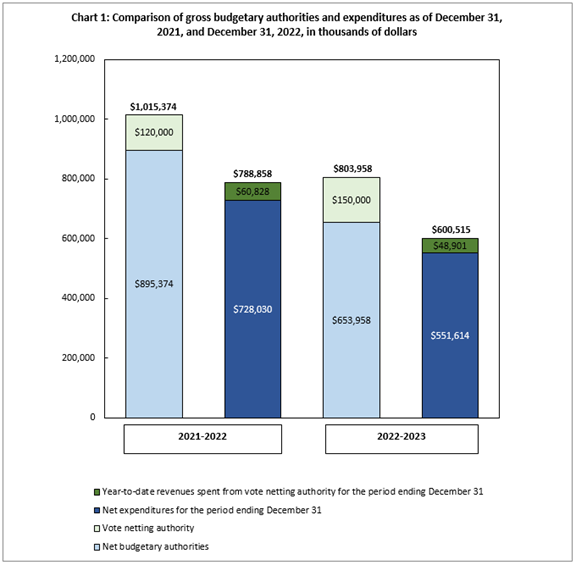
Description for Chart 1: Comparison of gross budgetary authorities and expenditures as of December 31, 2021, and December 31, 2022, in thousands of dollars
This bar graph shows Statistics Canada's budgetary authorities and expenditures, in thousands of dollars, as of December 31, 2021 and 2022:
- As at December 31, 2021
- Net budgetary authorities: $895,374
- Vote netting authority: $120,000
- Total authority: $1,015,374
- Net expenditures for the period ending December 31: $728,030
- Year-to-date revenues spent from vote netting authority for the period ending December 31: $60,828
- Total expenditures: $788,858
- As at December 31, 2022
- Net budgetary authorities: $653,958
- Vote netting authority: $150,000
- Total authority: $803,958
- Net expenditures for the period ending December 31: $551,614
- Year-to-date revenues spent from vote netting authority for the period ending December 31: $48,901
- Total expenditures: $600,515
Chart 1 outlines the gross budgetary authorities, which represent the resources available for use for the year as of December 31.
Significant changes to authorities
Total authorities available for 2022-23 have decreased by $211.4 million, or 20.8%, from the previous year, from $1,015.4 million to $804 million (Chart 1). The net decrease is mostly the result of the following:
- A decrease of $319.6 million for the 2021 Census of Population and Census of Agriculture programs due to the cyclical nature of funding winding down in 2022–2023;
- An increase of $36.8 million for the Disaggregated Data Action Plan;
- An increase of $1.9 million for collective bargaining;
- An increase of $31 million for various initiatives including Census of Environment, Quality of Life Framework for Canada, Supporting Access to Sexual and Reproductive Health Care Information and Services and Workload Migration Project.
In addition to the appropriations allocated to the agency through the Main Estimates, Statistics Canada also has vote net authority within Vote 1, which entitles the agency to spend revenues collected from other federal government departments, agencies, and external clients to provide statistical services. The vote netting authority increased by $30 million, or 25%, compared to the third quarters of fiscal years 2021-2022 and 2022-2023, from $120 million to $150 million.
Significant changes to expenditures
Year-to-date net expenditures recorded to the end of the third quarter decreased by $176.4 million, or 24.2% from the previous year, from $728 million to $551.6 million (see Table A: Variation in Departmental Expenditures by Standard Object).
Statistics Canada spent approximately 84.4% of its authorities by the end of the third quarter, compared with 81.3% in the same quarter of 2021-2022.
| Departmental Expenditures Variation by Standard Object: |
Q3 year-to-date variation between fiscal year 2021-2022 and 2022-2023 |
|
|---|---|---|
| $'000 | % | |
| (01) Personnel | -241 | 0.0 |
| (02) Transportation and communications | -47,380 | -80.6 |
| (03) Information | -16,790 | -76.4 |
| (04) Professional and special services | -119,555 | -81.6 |
| (05) Rentals | -4,496 | -21.9 |
| (06) Repair and maintenance | -612 | -57.5 |
| (07) Utilities, materials and supplies | -244 | -32.1 |
| (08) Acquisition of land, buildings and works | 270 | 1,227.3 |
| (09) Acquisition of machinery and equipment | -7 | -0.1 |
| (10) Transfer payments | - | N/A |
| (12) Other subsidies and payments | 712 | 85.8 |
| Total gross budgetary expenditures | -188,343 | -23.9 |
| Less revenues netted against expenditures: | ||
| Revenues | -11,927 | -19.6 |
| Total net budgetary expenditures | -176,416 | -24.2 |
| Note: Explanations are provided for variances of more than $1 million. | ||
Transportation and communications: The decrease is mainly due to postage costs for the mailing of Census questionnaires and related materials and travel expenditures for enumerators for the 2021 Census collection which occurred last fiscal year.
Information: The decrease is mainly due to printing and advertising costs for the 2021 Census which occurred last fiscal.
Professional and special services: The decrease is mainly due to the remuneration of Statistics Act employees hired to conduct the 2021 Census.
Rentals: The overall decrease is mainly due to the building space rentals related to the census operations as they are winding down in 2022-2023.
Revenues: The decrease is mainly due to a timing difference in invoicing compared to last year.
C) Significant changes to operations, personnel and programs
In 2022–2023, Statistics Canada will continue processing and analysing Census data, and disseminating the remaining major 2021 Census data releases. Six data releases took place in 2022-23 for the Census of Population (April, July, August, September, October and November 2022). There are seven major 'themed' (2021 Census dissemination planning, Release plans) release dates for the dissemination of data from the 2021 Census of Population. The Census of Agriculture took place in May of 2021. This contrasts with last year, when Statistics Canada focused on data collection and processing activities of the 2021 Census program.
The agency is managing other changes in operations and program activities with financial implications including:
- Continued effort and collaboration to provide data and insights related to the impact of the pandemic on the society and economy;
- New initiatives announced in the Budget 2021 are ramping up and activities related to those initiatives are on track;
- Increase in revenues due to cyclical programs and restoring paused programs post pandemic.
- Transition of the agency's IT infrastructure and applications to the Cloud
D) Risks and uncertainties
Statistics Canada will address the issues and corresponding uncertainties raised in this Quarterly Financial Report by implementing corresponding risk mitigation measures captured in the 2022-23 Corporate Risk Profile and at the program level.
Statistics Canada continues to pursue and invest in modernizing business processes and tools to maintain its relevance and maximize the value it provides to Canadians. To address uncertainties, the agency is implementing the Census of Environment, the Quality of Life Framework for Canada and the Disaggregated Data Action Plan initiatives to meet the evolving needs of users and remain relevant as an agency.
Statistics Canada requires a skilled workforce to achieve its objectives; however, it is difficult to compete with other organizations in the data ecosystem and the current labour market situation. To address uncertainties, Statistics Canada proactively recruits from universities and colleges across Canada promoting a strong workplace culture, a healthy work-life balance and put forward the Equity, Diversity and Inclusion Action Plan. In addition, the Integrated Business and Human Resources plan targets attracting talented employees with an increased focus on diversity, inclusion and official languages.
Statistics Canada is collaborating with federal partners to access IT services and support to realise its modernization objectives and transition its infrastructure and applications to the Cloud. To address uncertainties, the agency is working closely with its federal partners, while adhering to the agency's notable financial planning management practices and integrated strategic planning framework. Statistics Canada invested in aging IT infrastructure and transitioned to the Cloud. The financial risk related to the cloud cost have materialized as the actual costs of operating on the cloud are higher than estimated. The action plan to contain and optimize cloud operations is essential as we move into 2023-24.
Approval by senior officials
Approved by:
Anil Arora
Chief Statistician
Ottawa, Ontario
February 22, 2023
Kathleen Mitchell
Acting Chief Financial Officer
Ottawa, Ontario
February 8, 2023
Appendix
| Fiscal year 2022-2023 | Fiscal year 2021–2022 | |||||
|---|---|---|---|---|---|---|
| Total available for use for the year ending March 31, 2023Table note * | Used during the quarter ended December 31, 2022 | Year-to-date used at quarter-end | Total available for use for the year ending March 31, 2022Table note * | Used during the quarter ended December 31, 2021 | Year-to-date used at quarter-end | |
| in thousands of dollars | ||||||
| Vote 1 — Net operating expenditures | 565,503 | 146,983 | 491,638 | 808,940 | 146,904 | 667,199 |
| Statutory authority — Contribution to employee benefit plans | 88,455 | 19,992 | 59,976 | 86,434 | 20,277 | 60,831 |
| Total budgetary authorities | 653,958 | 166,975 | 551,614 | 895,374 | 167,181 | 728,030 |
|
||||||
| Fiscal year 2022-2023 | Fiscal year 2021–2022 | |||||
|---|---|---|---|---|---|---|
| Planned expenditures for the year ending March 31, 2023 | Expended during the quarter ended December 31, 2022 | Year-to-date used at quarter-end | Planned expenditures for the year ending March 31, 2022 | Expended during the quarter ended December 31, 2021 | Year-to-date used at quarter-end | |
| in thousands of dollars | ||||||
| Expenditures: | ||||||
| (01) Personnel | 665,875 | 178,497 | 533,055 | 678,110 | 169,408 | 533,296 |
| (02) Transportation and communications | 17,089 | 4,071 | 11,391 | 72,692 | 5,352 | 58,771 |
| (03) Information | 13,136 | 1,776 | 5,194 | 27,901 | 5,939 | 21,984 |
| (04) Professional and special services | 64,093 | 7,643 | 26,992 | 205,167 | 8,443 | 146,547 |
| (05) Rentals | 25,824 | 1,031 | 15,987 | 18,503 | 2,442 | 20,483 |
| (06) Repair and maintenance | 690 | 188 | 453 | 779 | 242 | 1,065 |
| (07) Utilities, materials and supplies | 2,804 | 138 | 515 | 1,924 | 162 | 759 |
| (08) Acquisition of land, buildings and works | 807 | 292 | 292 | 756 | 22 | 22 |
| (09) Acquisition of machinery and equipment | 10,116 | 2,787 | 5,094 | 9,485 | 2,399 | 5,101 |
| (10) Transfer payments | - | - | - | - | - | - |
| (12) Other subsidies and payments | 3,524 | 252 | 1,542 | 57 | 262 | 830 |
| Total gross budgetary expenditures | 803,958 | 196,675 | 600,515 | 1,015,374 | 194,671 | 788,858 |
| Less revenues netted against expenditures: | ||||||
| Revenues | 150,000 | 29,700 | 48,901 | 120,000 | 27,490 | 60,828 |
| Total revenues netted against expenditures | 150,000 | 29,700 | 48,901 | 120,000 | 27,490 | 60,828 |
| Total net budgetary expenditures | 653,958 | 166,975 | 551,614 | 895,374 | 167,181 | 728,030 |