
Statistics Canada
www.statcan.gc.ca
Common menu bar links
Chart 25.2 - Enlarged version and data source

Archived Content
Information identified as archived is provided for reference, research or recordkeeping purposes. It is not subject to the Government of Canada Web Standards and has not been altered or updated since it was archived. Please contact us to request a format other than those available.
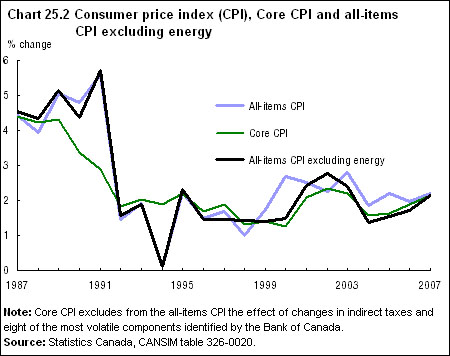
| All-items CPI | Core CPI | All-items CPI excluding energy | |
|---|---|---|---|
| % change | |||
| 1987 | 4.4 | 4.4 | 4.6 |
| 1988 | 3.9 | 4.2 | 4.4 |
| 1989 | 5.1 | 4.3 | 5.1 |
| 1990 | 4.8 | 3.4 | 4.4 |
| 1991 | 5.6 | 2.9 | 5.7 |
| 1992 | 1.4 | 1.8 | 1.6 |
| 1993 | 1.9 | 2.0 | 1.9 |
| 1994 | 0.1 | 1.9 | 0.1 |
| 1995 | 2.2 | 2.2 | 2.3 |
| 1996 | 1.5 | 1.7 | 1.5 |
| 1997 | 1.7 | 1.9 | 1.4 |
| 1998 | 1.0 | 1.3 | 1.4 |
| 1999 | 1.8 | 1.4 | 1.4 |
| 2000 | 2.7 | 1.3 | 1.5 |
| 2001 | 2.5 | 2.1 | 2.4 |
| 2002 | 2.2 | 2.4 | 2.8 |
| 2003 | 2.8 | 2.2 | 2.4 |
| 2004 | 1.8 | 1.6 | 1.4 |
| 2005 | 2.2 | 1.6 | 1.5 |
| 2006 | 2.0 | 1.9 | 1.7 |
| 2007 | 2.2 | 2.1 | 2.1 |
| Note: Core CPI excludes from the all-items CPI the effect of changes in indirect taxes and eight of the most volatile components identified by the Bank of Canada. | |||
| Source: Statistics Canada, CANSIM table 326-0020. | |||
