
Culture and leisure

Archived Content
Information identified as archived is provided for reference, research or recordkeeping purposes. It is not subject to the Government of Canada Web Standards and has not been altered or updated since it was archived. Please "contact us" to request a format other than those available.
Related information
Canada's TV broadcasters and specialty and pay channel operators have achieved their biggest annual revenue growth since 2003. Operating revenues for the industry reached $7.1 billion in 2010, up 8.0% from 2009. The revenue shares by segment were specialty TV, 37.5%; private conventional TV, 30.5%; public and non-commercial TV, 20.7%; and pay TV, 11.3%.
In 2010, 19,119 people worked in the television industry, down 16.6% from 22,934 in 2006. The majority, 7,221 employees, worked in public and non-commercial television, followed by private conventional television with 6,418 workers and pay and specialty television with 5,480 workers.
Employment in television has been falling since 2007. From 2009 to 2010, employment fell by 18.0% in public and non-commercial TV, the largest decline on record. Employment fell by 5.6% in private conventional television. Only speciality and pay TV saw more jobs—a 0.4% increase, mostly due to 7.2% more jobs in pay TV.
In 2010, TV employees earned more than $1.5 billion in salaries and benefits, a 5.4% drop from $1.6 billion in 2006.
Television broadcasting
Operating revenues in the television broadcasting sector reached $7.1 billion in 2010, up 8.0% from 2009. This was the largest annual increase since 2003 but comes on the heels of a more moderate growth of 0.7% in 2009.
In 2010, advertising revenues grew by 9.2% to $3.4 billion, nearly the same level as in 2008 before the economic slowdown. In 2009, advertising revenues of Canadian television broadcasters fell by 8.3% year over year to $3.1 billion, representing the first decrease in 15 years. However, results differed from one segment of the industry to another.
Private conventional television operating revenues rose 8.8% to $2.2 billion in 2010. The segment posted a profit margin before interest and taxes of 0.2% in 2010 to $5.4 million in profits before interest and taxes. This result follows on losses before interest and taxes of $113.4 million in 2009, the first losses posted by the private conventional television segment in 30 years.
Pay and specialty television continued its upward trend in 2010, with operating revenues increasing 11.1% year over year to $3.5 billion. This growth exceeded that of private conventional television (8.8%) and public and non-commercial television 0.4%). In 2010, the operating revenues of pay and specialty television represented 48.8% of the industry's operating revenues, up from 47.5% in 2009.
The profit margin before interest and taxes of the pay and specialty television segments rose to 25.4% in 2010 for profits before interest and taxes of $877.3 million. In 2009, this margin was 23.4% for profits of $728.6 million. Subscription revenues for pay and speciality television accounted for 31.7% of the television industry's total operating revenues in 2010, up from 22.5% in 2000.
Despite the importance of subscription revenues for specialty television, this segment has also continued to grow its share of the television advertising market, from 32.0% in 2009 to 32.6% in 2010. In 2001, specialty televisions share of the television advertising market stood at 17.1%.
Commercial radio profits
Operating revenues of commercial radio broadcasters totalled $1.6 billion (current dollars) in 2010, up 3.2% from 2009. Nearly all revenues were from advertising (97.6%). Even with the increase recorded in 2010, revenues have yet to surpass the level registered in 2008, before the 2008–2009 recession.
The revenue recovery for commercial radio in 2010 is reflected in their profit margin before interest and taxes, which rose from 17.9% in 2009 to 19.1%. Since the late 1990s, commercial radio has reported profit margins before interest and taxes in excess of 15%.
In 2010, commercial radio was the most profitable in Ontario, where the profit margin before interest and taxes was 22.9%, up from 21.7% in 2009. The lowest was in Saskatchewan at 11.0%. For the first time since 1976, the profit margin before interest and taxes of commercial radio broadcasters exceeded 10.0% in all regions. It reached 24.8% in large markets; 15.5% in medium markets, and 13.7% in small markets.
AM stations reported a 1.3% increase in operating revenue in 2010, while the number of stations declined to 147. These stations posted their best return in 20 years with a profit margin before interest and taxes of 10.0%. FM stations also increased their operating revenues by 3.7% in 2010, and had a profit margin before interest and taxes of 21.4%. The number of FM stations rose to 528.
In 2010, for a second consecutive year, francophone radio stations had stronger revenue growth 6.0%) than Anglophone (2.6%) and ethnic (4.5%) stations.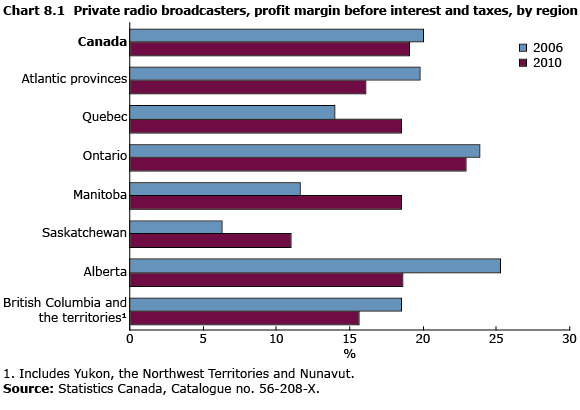
- Date modified: