
Economic Insights
Recent Developments in the Canadian Economy: Fall 2016

Archived Content
Information identified as archived is provided for reference, research or recordkeeping purposes. It is not subject to the Government of Canada Web Standards and has not been altered or updated since it was archived. Please "contact us" to request a format other than those available.
by Guy Gellatly and Elizabeth Richards, Analytical Studies Branch
Start of text box
This article in the Economic Insights series provides users with an integrated summary of recent changes in output, employment, household demand, international trade and prices. Organized as a statistical summary of major indicators, the report is designed to inform about recent developments in the Canadian economy, highlighting major changes in the economic data during the first two quarters of 2016 and into the summer months.Note 1 Unless otherwise noted, the tabulations presented in this report are based on seasonally adjusted data available in CANSIM on November 4, 2016.
End of text box
Overview
After household spending and exports supported growth in the first quarter, the economy contracted in the second on lower exports of energy and non-energy commodities. Non-residential business investment continued to weigh on growth in the second quarter, while household spending increased on services and non-durables. Non-conventional oil extraction fell sharply in the spring as maintenance and wildfires in Northern Alberta impacted production, but rebounded during late spring and into the summer months. In August, non-conventional oil extraction was 2.0% below levels at year-end 2015.
Lower energy and non-energy exports contributed to higher trade deficits in the first half of 2016. Energy exports totalled $30.9 billion from January to June, down 20.3% from the second half of 2015. Total non-energy exports in the first half of 2016, at $223.5 billion, were 1.9% lower than in the second half of 2015.
For consumers, retail spending moderated towards mid-year on slower sales at motor vehicle and parts dealers. As of August, sales at auto and parts dealers had declined in five of the last six months. Housing starts remained steady while investment in new housing construction strengthened in the first half of 2016.
Headline consumer inflation slowed to 1.1% in August as food prices moderated during the spring. Excluding food and energy, consumer inflation averaged 1.9% from January through September.
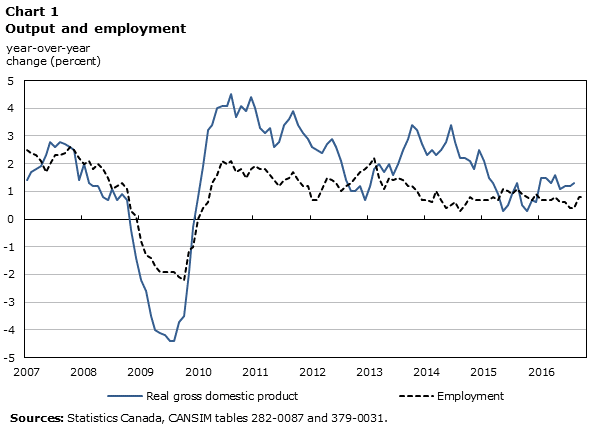
Employment rose by 44,000 in the first six months of the year on gains in part-time work and in services. Employment increased a further 62,000 in the third quarter, again on higher part-time work. Despite lower output in the second quarter, employment growth, measured year-over-over year, continued to lag output growth during the first half of 2016 (Chart 1).
Data table for Chart 1
| Year | Real gross domestic product | Employment |
|---|---|---|
| year-over-year change (percent) | ||
| 2007 | ||
| January | 1.4 | 2.5 |
| February | 1.7 | 2.4 |
| March | 1.8 | 2.3 |
| April | 1.9 | 2.1 |
| May | 2.3 | 1.7 |
| June | 2.8 | 2.0 |
| July | 2.6 | 2.3 |
| August | 2.8 | 2.3 |
| September | 2.7 | 2.4 |
| October | 2.6 | 2.6 |
| November | 2.5 | 2.5 |
| December | 1.4 | 2.2 |
| 2008 | ||
| January | 2.0 | 2.0 |
| February | 1.3 | 2.1 |
| March | 1.2 | 1.8 |
| April | 1.2 | 2.0 |
| May | 0.8 | 1.8 |
| June | 0.7 | 1.5 |
| July | 1.1 | 1.1 |
| August | 0.7 | 1.2 |
| September | 0.9 | 1.3 |
| October | 0.7 | 1.1 |
| November | -0.4 | 0.3 |
| December | -1.4 | 0.1 |
| 2009 | ||
| January | -2.2 | -0.8 |
| February | -2.6 | -1.3 |
| March | -3.5 | -1.4 |
| April | -4.0 | -1.7 |
| May | -4.1 | -1.9 |
| June | -4.2 | -1.9 |
| July | -4.4 | -1.9 |
| August | -4.4 | -1.9 |
| September | -3.7 | -2.1 |
| October | -3.5 | -2.2 |
| November | -1.9 | -1.1 |
| December | -0.3 | -1.0 |
| 2010 | ||
| January | 0.8 | 0.0 |
| February | 1.9 | 0.4 |
| March | 3.2 | 0.6 |
| April | 3.4 | 1.3 |
| May | 4.0 | 1.6 |
| June | 4.1 | 2.1 |
| July | 4.1 | 2.0 |
| August | 4.5 | 2.1 |
| September | 3.7 | 1.7 |
| October | 4.1 | 1.8 |
| November | 3.9 | 1.5 |
| December | 4.4 | 1.8 |
| 2011 | ||
| January | 4.0 | 1.9 |
| February | 3.3 | 1.8 |
| March | 3.1 | 1.8 |
| April | 3.3 | 1.6 |
| May | 2.6 | 1.4 |
| June | 2.8 | 1.2 |
| July | 3.4 | 1.4 |
| August | 3.6 | 1.5 |
| September | 3.9 | 1.7 |
| October | 3.4 | 1.4 |
| November | 3.1 | 1.2 |
| December | 2.9 | 1.2 |
| 2012 | ||
| January | 2.6 | 0.7 |
| February | 2.5 | 0.7 |
| March | 2.4 | 1.1 |
| April | 2.7 | 1.5 |
| May | 2.9 | 1.4 |
| June | 2.6 | 1.3 |
| July | 2.1 | 1.0 |
| August | 1.4 | 1.2 |
| September | 1.0 | 1.3 |
| October | 1.0 | 1.5 |
| November | 1.2 | 1.7 |
| December | 0.7 | 1.8 |
| 2013 | ||
| January | 1.2 | 2.0 |
| February | 1.8 | 2.2 |
| March | 2.0 | 1.5 |
| April | 1.7 | 1.1 |
| May | 2.0 | 1.5 |
| June | 1.6 | 1.4 |
| July | 2.0 | 1.5 |
| August | 2.5 | 1.4 |
| September | 2.9 | 1.2 |
| October | 3.4 | 1.2 |
| November | 3.2 | 1.0 |
| December | 2.7 | 0.7 |
| 2014 | ||
| January | 2.3 | 0.7 |
| February | 2.5 | 0.6 |
| March | 2.3 | 1.0 |
| April | 2.5 | 0.7 |
| May | 2.8 | 0.4 |
| June | 3.4 | 0.5 |
| July | 2.8 | 0.6 |
| August | 2.2 | 0.3 |
| September | 2.2 | 0.5 |
| October | 2.1 | 0.8 |
| November | 1.8 | 0.7 |
| December | 2.5 | 0.7 |
| 2015 | ||
| January | 2.1 | 0.7 |
| February | 1.5 | 0.7 |
| March | 1.3 | 0.8 |
| April | 0.9 | 0.7 |
| May | 0.3 | 1.1 |
| June | 0.5 | 1.0 |
| July | 0.9 | 0.9 |
| August | 1.3 | 1.1 |
| September | 0.5 | 0.9 |
| October | 0.3 | 0.8 |
| November | 0.7 | 0.7 |
| December | 0.6 | 0.9 |
| 2016 | ||
| January | 1.5 | 0.7 |
| February | 1.5 | 0.7 |
| March | 1.3 | 0.7 |
| April | 1.6 | 0.8 |
| May | 1.1 | 0.6 |
| June | 1.2 | 0.6 |
| July | 1.2 | 0.4 |
| August | 1.3 | 0.4 |
| September | 0.8 | |
| October | 0.8 | |
| Sources: Statistics Canada, CANSIM tables 282-0087 and 379-0031. | ||
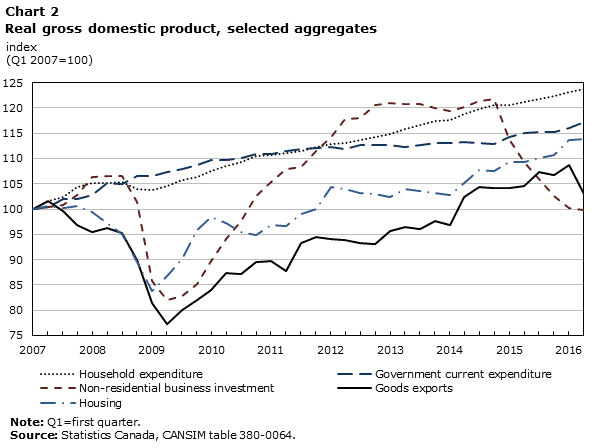
Output declined on lower exports in the second quarter
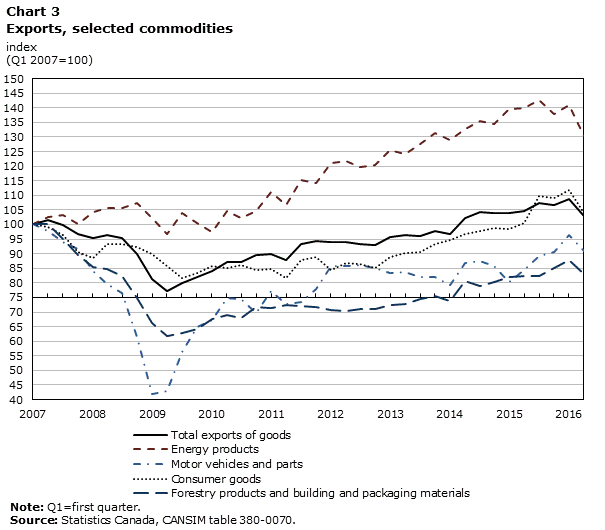
Real GDP declined 0.4% in the second quarter of 2016, following a 0.6% gain in the first quarter. A broad-based decline in export volumes was the major contributor to the contraction in second quarter GDP (Chart 2). Goods exports fell 5.5%, following a 2.0% gain in the first quarter, as exports of energy-products, motor vehicles and parts, consumer goods, and metal ores and non-metallic mineral products declined (Chart 3).
Data table for Chart 2
| Year | Household expenditure | Government current expenditure | Non-residential business investment | Goods exports | Housing |
|---|---|---|---|---|---|
| index (Q1 2007=100) | |||||
| 2007 | |||||
| First quarter | 100.0 | 100.0 | 100.0 | 100.0 | 100.0 |
| Second quarter | 101.5 | 100.5 | 100.5 | 101.6 | 100.6 |
| Third quarter | 102.4 | 101.9 | 100.9 | 99.7 | 100.3 |
| Fourth quarter | 104.3 | 101.9 | 102.7 | 96.9 | 100.7 |
| 2008 | |||||
| First quarter | 105.1 | 102.8 | 106.4 | 95.5 | 99.5 |
| Second quarter | 105.2 | 105.1 | 106.6 | 96.3 | 97.2 |
| Third quarter | 105.3 | 105.0 | 106.6 | 95.2 | 95.0 |
| Fourth quarter | 104.0 | 106.5 | 101.3 | 89.9 | 89.5 |
| 2009 | |||||
| First quarter | 103.7 | 106.6 | 85.7 | 81.4 | 83.7 |
| Second quarter | 104.5 | 107.4 | 82.1 | 77.3 | 86.7 |
| Third quarter | 105.7 | 108.0 | 82.8 | 80.1 | 90.2 |
| Fourth quarter | 106.4 | 108.8 | 85.2 | 82.1 | 95.8 |
| 2010 | |||||
| First quarter | 107.6 | 109.8 | 89.8 | 84.0 | 98.5 |
| Second quarter | 108.5 | 109.7 | 94.1 | 87.3 | 97.3 |
| Third quarter | 109.4 | 110.1 | 97.6 | 87.1 | 95.5 |
| Fourth quarter | 110.4 | 110.8 | 102.5 | 89.5 | 94.8 |
| 2011 | |||||
| First quarter | 110.6 | 110.9 | 105.4 | 89.8 | 96.8 |
| Second quarter | 111.1 | 111.4 | 108.0 | 87.7 | 96.6 |
| Third quarter | 111.5 | 111.8 | 108.4 | 93.3 | 99.1 |
| Fourth quarter | 112.2 | 112.1 | 111.5 | 94.5 | 100.1 |
| 2012 | |||||
| First quarter | 112.9 | 112.2 | 114.2 | 94.1 | 104.4 |
| Second quarter | 113.0 | 111.9 | 117.8 | 93.9 | 103.9 |
| Third quarter | 113.7 | 112.7 | 118.1 | 93.2 | 103.1 |
| Fourth quarter | 114.3 | 112.6 | 120.6 | 93.1 | 103.0 |
| 2013 | |||||
| First quarter | 114.9 | 112.7 | 120.9 | 95.6 | 102.3 |
| Second quarter | 115.8 | 112.2 | 120.8 | 96.5 | 104.0 |
| Third quarter | 116.7 | 112.7 | 120.8 | 96.0 | 103.6 |
| Fourth quarter | 117.4 | 113.1 | 119.9 | 97.6 | 103.1 |
| 2014 | |||||
| First quarter | 117.7 | 113.0 | 119.4 | 96.9 | 102.7 |
| Second quarter | 118.9 | 113.2 | 120.1 | 102.3 | 105.1 |
| Third quarter | 119.8 | 113.0 | 121.4 | 104.4 | 107.7 |
| Fourth quarter | 120.5 | 112.9 | 121.7 | 104.1 | 107.6 |
| 2015 | |||||
| First quarter | 120.5 | 114.2 | 113.9 | 104.1 | 109.3 |
| Second quarter | 121.1 | 115.0 | 109.3 | 104.6 | 109.3 |
| Third quarter | 121.8 | 115.2 | 106.0 | 107.3 | 110.1 |
| Fourth quarter | 122.4 | 115.3 | 102.5 | 106.7 | 110.6 |
| 2016 | |||||
| First quarter | 123.1 | 116.1 | 100.3 | 108.8 | 113.6 |
| Second quarter | 123.8 | 117.3 | 99.9 | 102.9 | 113.9 |
|
Note: Q1=first quarter. Source: Statistics Canada, CANSIM table 380-0064. |
|||||
Data table for Chart 3
| Year | Total exports of goods | Energy products | Motor vehicles and parts | Consumer goods | Forestry products and building and packaging materials |
|---|---|---|---|---|---|
| index (Q1 2007=100) | |||||
| 2007 | |||||
| First quarter | 100.0 | 100.0 | 100.0 | 100.0 | 100.0 |
| Second quarter | 101.6 | 102.6 | 97.7 | 99.3 | 100.1 |
| Third quarter | 99.7 | 103.2 | 94.0 | 96.3 | 95.0 |
| Fourth quarter | 96.9 | 100.1 | 91.7 | 90.7 | 89.6 |
| 2008 | |||||
| First quarter | 95.5 | 104.3 | 84.1 | 88.6 | 85.5 |
| Second quarter | 96.3 | 105.6 | 79.6 | 93.4 | 84.8 |
| Third quarter | 95.2 | 105.8 | 76.6 | 93.4 | 82.4 |
| Fourth quarter | 89.9 | 107.4 | 61.4 | 92.4 | 74.8 |
| 2009 | |||||
| First quarter | 81.4 | 102.3 | 42.0 | 89.9 | 66.4 |
| Second quarter | 77.3 | 96.8 | 43.0 | 85.7 | 61.8 |
| Third quarter | 80.1 | 104.1 | 56.3 | 81.6 | 62.9 |
| Fourth quarter | 82.1 | 100.6 | 65.0 | 83.4 | 64.1 |
| 2010 | |||||
| First quarter | 84.0 | 97.3 | 67.1 | 85.8 | 67.5 |
| Second quarter | 87.3 | 104.7 | 74.8 | 85.2 | 69.0 |
| Third quarter | 87.1 | 102.1 | 74.5 | 86.0 | 67.8 |
| Fourth quarter | 89.5 | 104.7 | 69.6 | 84.5 | 71.7 |
| 2011 | |||||
| First quarter | 89.8 | 111.0 | 77.2 | 84.6 | 71.5 |
| Second quarter | 87.7 | 106.7 | 72.6 | 81.8 | 72.3 |
| Third quarter | 93.3 | 115.1 | 73.3 | 87.8 | 72.0 |
| Fourth quarter | 94.5 | 114.3 | 77.9 | 88.8 | 71.7 |
| 2012 | |||||
| First quarter | 94.1 | 121.1 | 85.9 | 84.5 | 70.8 |
| Second quarter | 93.9 | 121.7 | 85.7 | 86.9 | 70.4 |
| Third quarter | 93.2 | 119.7 | 86.2 | 86.4 | 71.1 |
| Fourth quarter | 93.1 | 120.5 | 85.0 | 85.0 | 71.0 |
| 2013 | |||||
| First quarter | 95.6 | 125.7 | 83.4 | 88.9 | 72.4 |
| Second quarter | 96.5 | 124.1 | 83.7 | 90.1 | 72.9 |
| Third quarter | 96.0 | 127.7 | 82.1 | 90.7 | 74.6 |
| Fourth quarter | 97.6 | 131.4 | 81.9 | 93.4 | 75.6 |
| 2014 | |||||
| First quarter | 96.9 | 129.1 | 79.1 | 94.6 | 73.7 |
| Second quarter | 102.3 | 132.8 | 86.8 | 96.8 | 80.5 |
| Third quarter | 104.4 | 135.4 | 87.5 | 97.9 | 79.0 |
| Fourth quarter | 104.1 | 134.3 | 85.6 | 98.7 | 80.4 |
| 2015 | |||||
| First quarter | 104.1 | 139.6 | 80.3 | 98.3 | 82.1 |
| Second quarter | 104.6 | 140.0 | 84.5 | 100.5 | 82.2 |
| Third quarter | 107.3 | 142.6 | 89.2 | 109.8 | 82.3 |
| Fourth quarter | 106.7 | 137.7 | 90.6 | 109.0 | 85.0 |
| 2016 | |||||
| First quarter | 108.8 | 140.9 | 96.5 | 111.8 | 87.8 |
| Second quarter | 102.9 | 130.3 | 90.9 | 104.1 | 82.9 |
|
Note: Q1=first quarter. Source: Statistics Canada, CANSIM table 380-0070. |
|||||
Exports of crude oil and crude bitumen were 9.6% lower in the second quarter, while refined petroleum energy products declined by 19.6%. Motor vehicle and parts exports declined 5.8% in the second quarter, following four consecutive quarterly gains. Despite this recent decline, automotive exports in the second quarter were 7.5% higher on a year-over-year basis, as passenger cars and light trucks posted notable gains during the second half of 2015 and the first quarter of 2016.
Data table for Chart 4
| Year | Total business gross fixed capital formation | Residential structures | Non-residential structures | Machinery and equipment | Intellectual property products |
|---|---|---|---|---|---|
| index (Q1 2007=100) | |||||
| 2007 | |||||
| First quarter | 100.0 | 100.0 | 100.0 | 100.0 | 100.0 |
| Second quarter | 100.6 | 100.6 | 99.8 | 101.3 | 100.7 |
| Third quarter | 100.8 | 100.3 | 100.2 | 101.6 | 102.1 |
| Fourth quarter | 102.1 | 100.7 | 100.5 | 105.0 | 104.5 |
| 2008 | |||||
| First quarter | 104.0 | 99.5 | 107.2 | 105.4 | 107.6 |
| Second quarter | 103.3 | 97.2 | 108.7 | 104.1 | 107.6 |
| Third quarter | 102.2 | 95.0 | 109.3 | 103.3 | 105.8 |
| Fourth quarter | 96.8 | 89.5 | 106.6 | 95.3 | 100.1 |
| 2009 | |||||
| First quarter | 85.1 | 83.7 | 91.8 | 79.1 | 88.0 |
| Second quarter | 83.9 | 86.7 | 85.7 | 77.9 | 85.4 |
| Third quarter | 85.5 | 90.2 | 84.9 | 80.3 | 85.6 |
| Fourth quarter | 89.0 | 95.8 | 85.7 | 84.3 | 87.7 |
| 2010 | |||||
| First quarter | 92.9 | 98.5 | 93.9 | 84.9 | 91.8 |
| Second quarter | 95.1 | 97.3 | 98.6 | 88.8 | 95.6 |
| Third quarter | 96.5 | 95.5 | 104.7 | 89.2 | 97.6 |
| Fourth quarter | 98.8 | 94.8 | 111.2 | 92.1 | 97.7 |
| 2011 | |||||
| First quarter | 100.7 | 96.8 | 115.5 | 93.3 | 95.6 |
| Second quarter | 102.6 | 96.6 | 114.6 | 100.2 | 101.0 |
| Third quarter | 104.1 | 99.1 | 119.5 | 95.0 | 104.0 |
| Fourth quarter | 106.1 | 100.1 | 124.0 | 96.5 | 104.1 |
| 2012 | |||||
| First quarter | 109.1 | 104.4 | 127.3 | 98.3 | 104.7 |
| Second quarter | 110.3 | 103.9 | 133.1 | 99.1 | 99.8 |
| Third quarter | 110.2 | 103.1 | 133.7 | 99.0 | 100.7 |
| Fourth quarter | 111.4 | 103.0 | 138.1 | 99.1 | 99.7 |
| 2013 | |||||
| First quarter | 110.9 | 102.3 | 141.5 | 95.5 | 96.7 |
| Second quarter | 111.3 | 104.0 | 143.0 | 93.2 | 94.5 |
| Third quarter | 111.3 | 103.6 | 144.9 | 90.7 | 96.5 |
| Fourth quarter | 110.7 | 103.1 | 144.1 | 89.8 | 96.1 |
| 2014 | |||||
| First quarter | 109.9 | 102.7 | 143.2 | 89.8 | 92.7 |
| Second quarter | 111.0 | 105.1 | 142.9 | 91.7 | 91.8 |
| Third quarter | 112.6 | 107.7 | 142.9 | 94.8 | 91.2 |
| Fourth quarter | 112.7 | 107.6 | 142.1 | 96.5 | 91.8 |
| 2015 | |||||
| First quarter | 108.4 | 109.3 | 129.2 | 95.2 | 83.1 |
| Second quarter | 105.7 | 109.3 | 123.9 | 91.2 | 80.9 |
| Third quarter | 104.2 | 110.1 | 119.3 | 89.7 | 80.1 |
| Fourth quarter | 102.5 | 110.6 | 114.4 | 87.8 | 79.4 |
| 2016 | |||||
| First quarter | 102.4 | 113.6 | 110.6 | 87.6 | 78.5 |
| Second quarter | 102.2 | 113.9 | 109.4 | 88.0 | 78.5 |
|
Note: Q1=first quarter. Source: Statistics Canada, CANSIM table 380-0068. |
|||||
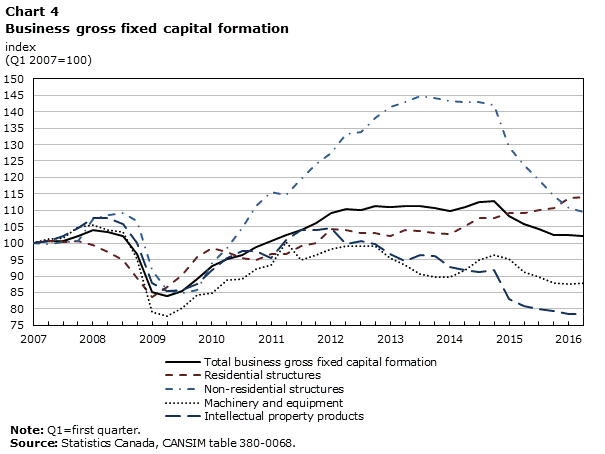
Non-residential business investment edged down 0.5% in the second quarter of 2016, marking the sixth consecutive quarterly decline. Lower outlays on non-residential structures (-1.1%) weighed on business investment, as capital spending on engineering structures contracted for the 11th consecutive quarter. Outlays on engineering structures were 13% lower on a year-over-year basis, and about 27% below levels in the second quarter of 2014 (Chart 4).
Business outlays on machinery and equipment edged up 0.5% in the second quarter, after five consecutive quarterly declines. Spending on computer equipment supported the gain, while outlays on industrial equipment declined.
Business spending on intellectual property products was little changed in the second quarter, as higher outlays on software and mineral exploration and evaluation offset lower spending on research and development. Outlays on mineral exploration and evaluation edged up for the second consecutive quarter, after notable declines during 2015. Outlays on exploration and evaluation in the second quarter were about 10% lower on a year-over-year basis, and down 48% from levels in the second quarter of 2014.
Business investment in residential structures increased 0.3% in the second quarter, after a 2.7% increase in the first. Ownership transfer costs, reflecting higher activity in resale markets, supported gains during the first half of the year. Outlays on new construction and renovations declined in the second quarter, following gains in the first.
Consumer spending continued to support economic growth during the first half of the year. Household expenditures rose 0.5% in the second quarter, after increasing 0.6% in the first. Higher spending on services and non-durables supported the gain, as spending on durables declined. Household expenditures on water, electricity, insurance, and transport services strengthened in the second quarter, while vehicle purchases fell 1.2% following four consecutive quarterly increases.
The wildfires in Northern Alberta, combined with uncertain market conditions in the energy sector, had a major impact on the pace of economic growth during the second quarter. Excluding crude petroleum from exports, imports and inventories, real output edged up 0.1%.Note 2
The wildfires also contributed to lower productivity in the second quarter. Labour productivity in the business sector fell 0.3%, following a 0.4% increase to the start the year. Productivity in mining and oil and gas extraction edged down as the decline in real output (-6.7%) outpaced the reduction in hours worked (-6.2%). Productivity in manufacturing also declined in the second quarter. Industrial capacity utilization declined to 80.0%, the lowest level since late 2010. Capacity utilization in oil and gas extraction declined to 73.9%, the lowest level since the third quarter of 2012.
After weighing on national income growth in recent quarters, improvements in the terms of trade supported an increase in real gross domestic income (+0.2%) in the second quarter. Following a 0.3% increase to start the year, nominal GDP was little changed in the second quarter.
In the United States, real GDP, measured on an annualized basis, rose 1.4% in the second quarter of 2016, following a 0.8% gain in the first.Note 3 According to advance estimates, U.S. real GDP strengthened to 2.9% in the third quarter. U.S. nominal GDP increased 4.4% (annualized) and 3.7% in the second, following a 1.3% gain in the first.
Output strengthened at mid-year on higher goods production
After a 0.6% decline in May on lower oil production, real GDP in Canada rebounded in June (+0.6%) and July (+0.4%) as oil and gas extraction strengthened. Output rose 0.2% in August.
Following declines in February and March, goods production rebounded into the summer months. By August, the output of goods industries was similar (-0.1%) to levels at year end. Utilities supported goods production during the first half of the year, while construction output continued to trend lower on declines in engineering and non-residential buildings (Chart 5). Residential construction also declined from April to July.
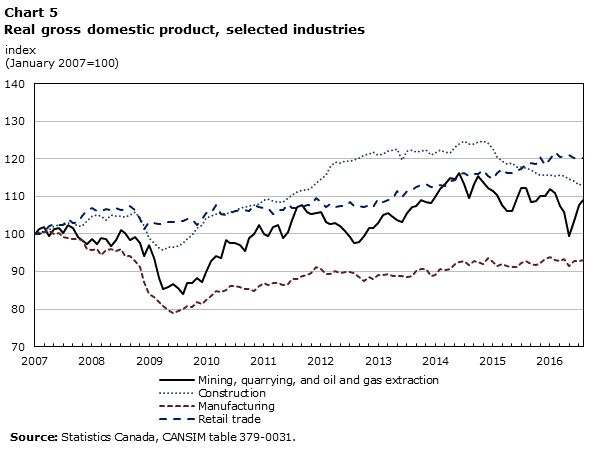
Data table for Chart 5
| Year | Mining, quarrying, and oil and gas extraction | Construction | Manufacturing | Retail trade |
|---|---|---|---|---|
| index (January 2007=100) | ||||
| 2007 | ||||
| January | 100.0 | 100.0 | 100.0 | 100.0 |
| February | 101.2 | 100.2 | 100.5 | 100.1 |
| March | 101.8 | 100.7 | 100.5 | 100.4 |
| April | 99.4 | 101.1 | 100.8 | 102.0 |
| May | 101.2 | 102.1 | 100.0 | 102.6 |
| June | 101.7 | 102.3 | 100.2 | 102.4 |
| July | 100.2 | 102.4 | 99.3 | 102.5 |
| August | 102.4 | 102.8 | 99.0 | 103.9 |
| September | 101.5 | 102.8 | 98.7 | 102.9 |
| October | 99.3 | 102.0 | 98.7 | 103.3 |
| November | 98.4 | 102.2 | 98.5 | 104.7 |
| December | 97.4 | 103.4 | 95.9 | 106.4 |
| 2008 | ||||
| January | 98.7 | 104.8 | 95.6 | 107.0 |
| February | 97.4 | 105.1 | 95.9 | 106.1 |
| March | 99.0 | 104.8 | 94.3 | 106.2 |
| April | 98.6 | 103.7 | 95.6 | 106.6 |
| May | 96.7 | 105.1 | 96.1 | 106.5 |
| June | 98.3 | 104.7 | 95.5 | 106.9 |
| July | 101.0 | 104.7 | 95.9 | 106.4 |
| August | 100.2 | 104.5 | 94.2 | 106.6 |
| September | 98.4 | 105.1 | 94.2 | 107.4 |
| October | 99.2 | 105.8 | 92.8 | 106.3 |
| November | 97.5 | 104.3 | 91.2 | 104.0 |
| December | 94.2 | 102.1 | 87.2 | 101.3 |
| 2009 | ||||
| January | 97.0 | 98.8 | 84.1 | 103.1 |
| February | 93.5 | 97.5 | 83.2 | 102.9 |
| March | 88.2 | 96.3 | 82.0 | 102.7 |
| April | 85.4 | 95.7 | 80.7 | 102.6 |
| May | 85.8 | 96.4 | 79.7 | 103.1 |
| June | 86.6 | 96.5 | 79.0 | 103.3 |
| July | 85.5 | 96.8 | 79.6 | 103.4 |
| August | 83.9 | 97.5 | 80.0 | 103.5 |
| September | 87.0 | 98.6 | 80.9 | 104.1 |
| October | 87.0 | 99.6 | 80.5 | 104.0 |
| November | 88.2 | 101.5 | 81.8 | 102.3 |
| December | 87.2 | 102.5 | 81.4 | 104.0 |
| 2010 | ||||
| January | 90.0 | 104.3 | 82.3 | 105.6 |
| February | 92.8 | 104.8 | 83.4 | 105.6 |
| March | 94.0 | 105.2 | 84.7 | 107.8 |
| April | 93.6 | 105.6 | 84.6 | 105.4 |
| May | 98.3 | 105.4 | 85.0 | 105.0 |
| June | 97.7 | 105.9 | 86.1 | 105.7 |
| July | 97.5 | 106.1 | 86.1 | 106.0 |
| August | 97.1 | 106.8 | 86.0 | 106.4 |
| September | 95.5 | 107.1 | 85.4 | 106.4 |
| October | 98.9 | 107.5 | 85.3 | 106.0 |
| November | 100.1 | 107.8 | 84.8 | 107.7 |
| December | 102.4 | 108.0 | 86.2 | 107.1 |
| 2011 | ||||
| January | 100.0 | 109.0 | 87.0 | 106.8 |
| February | 99.5 | 109.4 | 86.3 | 106.8 |
| March | 101.8 | 108.8 | 86.9 | 105.3 |
| April | 102.5 | 108.6 | 86.9 | 106.5 |
| May | 98.8 | 108.4 | 86.4 | 106.5 |
| June | 100.5 | 109.5 | 86.8 | 107.9 |
| July | 103.6 | 110.3 | 88.1 | 106.9 |
| August | 107.3 | 111.1 | 87.9 | 106.8 |
| September | 107.6 | 111.6 | 88.9 | 107.1 |
| October | 105.9 | 111.8 | 89.1 | 107.8 |
| November | 105.2 | 112.3 | 89.6 | 107.8 |
| December | 105.6 | 113.5 | 91.1 | 109.5 |
| 2012 | ||||
| January | 105.8 | 114.7 | 90.7 | 108.5 |
| February | 103.1 | 115.8 | 89.3 | 107.3 |
| March | 102.6 | 117.7 | 89.3 | 107.9 |
| April | 102.8 | 119.2 | 90.2 | 107.1 |
| May | 102.2 | 118.8 | 89.7 | 107.5 |
| June | 100.9 | 119.3 | 89.8 | 107.5 |
| July | 99.1 | 119.5 | 89.8 | 108.5 |
| August | 97.5 | 119.7 | 89.5 | 107.4 |
| September | 97.8 | 120.3 | 88.5 | 107.4 |
| October | 99.5 | 121.1 | 87.5 | 107.3 |
| November | 101.5 | 121.4 | 88.5 | 107.7 |
| December | 101.7 | 121.7 | 87.9 | 107.1 |
| 2013 | ||||
| January | 102.8 | 121.1 | 89.0 | 109.3 |
| February | 105.0 | 121.4 | 89.2 | 108.6 |
| March | 105.6 | 122.0 | 89.4 | 109.0 |
| April | 104.6 | 122.4 | 88.9 | 109.6 |
| May | 103.6 | 122.6 | 88.7 | 111.4 |
| June | 103.3 | 119.7 | 88.7 | 109.9 |
| July | 105.7 | 122.0 | 88.5 | 111.3 |
| August | 107.3 | 122.2 | 88.7 | 111.8 |
| September | 107.5 | 121.9 | 90.1 | 112.6 |
| October | 109.1 | 122.1 | 90.7 | 113.0 |
| November | 108.4 | 122.3 | 90.6 | 113.4 |
| December | 108.1 | 121.1 | 88.9 | 112.4 |
| 2014 | ||||
| January | 109.7 | 121.6 | 89.2 | 112.5 |
| February | 112.0 | 122.3 | 90.8 | 113.1 |
| March | 113.3 | 121.7 | 90.3 | 112.8 |
| April | 114.8 | 121.6 | 90.8 | 114.2 |
| May | 114.6 | 123.2 | 92.0 | 114.4 |
| June | 116.1 | 123.8 | 92.5 | 116.0 |
| July | 113.3 | 124.8 | 92.9 | 116.1 |
| August | 109.5 | 123.9 | 91.8 | 115.5 |
| September | 113.4 | 124.0 | 92.8 | 116.0 |
| October | 115.3 | 124.5 | 92.6 | 116.0 |
| November | 113.7 | 124.6 | 92.1 | 116.9 |
| December | 112.3 | 124.2 | 93.7 | 115.4 |
| 2015 | ||||
| January | 111.4 | 122.5 | 92.6 | 114.5 |
| February | 110.3 | 120.5 | 91.6 | 116.3 |
| March | 107.7 | 119.4 | 92.1 | 117.3 |
| April | 106.2 | 118.6 | 91.6 | 116.2 |
| May | 106.1 | 118.9 | 91.2 | 116.2 |
| June | 109.5 | 117.9 | 91.3 | 116.9 |
| July | 112.1 | 117.7 | 92.3 | 117.3 |
| August | 112.2 | 117.6 | 92.7 | 118.6 |
| September | 108.5 | 117.0 | 92.0 | 118.8 |
| October | 108.7 | 116.1 | 91.8 | 118.6 |
| November | 110.0 | 115.6 | 92.2 | 120.5 |
| December | 110.2 | 115.8 | 93.3 | 118.4 |
| 2016 | ||||
| January | 112.0 | 115.7 | 93.9 | 120.0 |
| February | 111.0 | 115.4 | 93.0 | 121.9 |
| March | 107.4 | 115.6 | 92.7 | 120.6 |
| April | 105.9 | 115.5 | 93.2 | 120.7 |
| May | 99.5 | 114.5 | 91.5 | 121.1 |
| June | 103.5 | 114.1 | 92.8 | 120.2 |
| July | 107.6 | 113.1 | 92.8 | 120.3 |
| August | 109.1 | 113.6 | 93.0 | 120.1 |
| Source: Statistics Canada, CANSIM table 379-0031. | ||||
After strengthening into early 2016, manufacturing output subsequently moderated, before falling 1.8% in May as supply disruptions affected both petroleum refineries and auto production. As of August, manufacturing output was down slightly from year-end levels, as output rebounded in the summer months. Gains in food, primary metals and chemicals offset declines. Motor vehicle and parts production moderated in the first half of 2016. Output in the auto sector in August was 0.4% above levels at year end.
The output of service industries advanced from January to July, supported by gains in finance and insurance, real estate, and information and cultural services. Wholesale trade posted increases in May and June as building materials and machinery and equipment supported gains. Professional, scientific and technical services also increased during the spring as gains in computer systems design offset lower output in architecture, engineering and related services. The output of service industries was unchanged in August as activity at real estate agents and brokers declined.
Non-conventional oil extraction rebounded from wildfires
Oil and gas extraction declined from February to May on lower non-conventional oil production.Note 4 Non-conventional output fell 5.7% in April as maintenance activities affected production, and an additional 22.2% in May as many operations shut down in response to the wildfires in Northern Alberta. Non-conventional production ramped up in June (+14.5%) and July (+17.3%) as affected production was brought back on line. As of August, non-conventional output was down 2.0% from levels at year end. Conversely, conventional oil and gas extraction strengthened from April to August. Conventional output in August was 3.7% higher than levels in December 2015 (Chart 6).
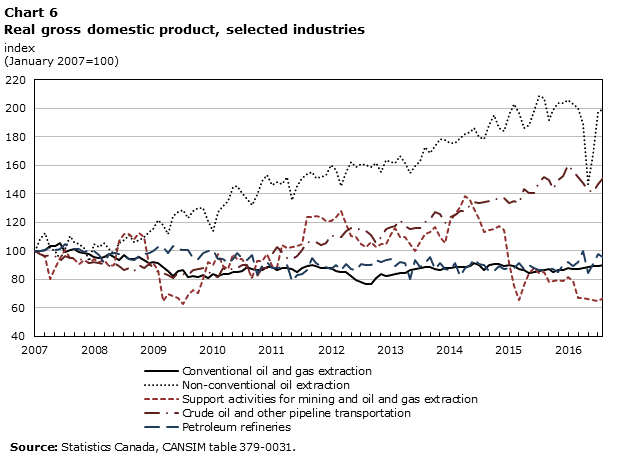
Data table for Chart 6
| Year | Conventional oil and gas extraction | Non-conventional oil extraction | Support activities for mining and oil and gas extraction | Crude oil and other pipeline transportation | Petroleum refineries |
|---|---|---|---|---|---|
| index (January 2007=100) | |||||
| 2007 | |||||
| January | 100.0 | 100.0 | 100.0 | 100.0 | 100.0 |
| February | 100.2 | 108.1 | 98.8 | 97.7 | 99.8 |
| March | 100.3 | 112.5 | 95.5 | 96.6 | 100.7 |
| April | 103.4 | 102.3 | 80.3 | 96.8 | 102.7 |
| May | 103.7 | 100.0 | 88.1 | 96.1 | 100.6 |
| June | 105.5 | 94.4 | 95.1 | 93.2 | 101.5 |
| July | 99.5 | 101.6 | 100.9 | 96.6 | 104.6 |
| August | 100.8 | 110.6 | 94.9 | 95.3 | 102.1 |
| September | 101.0 | 106.4 | 94.1 | 94.8 | 101.6 |
| October | 99.4 | 105.1 | 90.8 | 94.0 | 101.4 |
| November | 98.3 | 101.8 | 93.4 | 93.6 | 98.9 |
| December | 97.9 | 93.2 | 91.6 | 91.7 | 100.3 |
| 2008 | |||||
| January | 95.7 | 104.9 | 94.3 | 92.3 | 99.8 |
| February | 94.7 | 102.5 | 92.2 | 91.7 | 97.4 |
| March | 95.9 | 105.7 | 93.3 | 90.6 | 91.6 |
| April | 97.5 | 101.6 | 89.4 | 89.4 | 97.6 |
| May | 95.4 | 97.9 | 90.3 | 91.7 | 98.3 |
| June | 93.5 | 105.2 | 106.8 | 89.4 | 97.9 |
| July | 97.2 | 107.9 | 111.6 | 86.8 | 96.4 |
| August | 94.5 | 110.9 | 111.6 | 87.6 | 94.0 |
| September | 94.4 | 106.3 | 108.2 | 86.1 | 93.9 |
| October | 95.9 | 107.3 | 112.2 | 89.8 | 96.1 |
| November | 93.6 | 109.4 | 110.0 | 88.1 | 97.9 |
| December | 91.1 | 112.9 | 89.7 | 90.7 | 98.2 |
| 2009 | |||||
| January | 92.1 | 115.1 | 91.7 | 88.3 | 100.2 |
| February | 91.4 | 121.6 | 86.4 | 85.2 | 102.4 |
| March | 88.5 | 118.2 | 64.7 | 84.3 | 103.0 |
| April | 85.9 | 111.9 | 69.9 | 83.2 | 98.2 |
| May | 82.4 | 124.7 | 68.1 | 80.7 | 103.6 |
| June | 85.8 | 127.2 | 67.2 | 84.3 | 101.2 |
| July | 86.3 | 128.8 | 62.4 | 83.4 | 100.7 |
| August | 81.7 | 122.8 | 68.7 | 82.8 | 100.4 |
| September | 82.1 | 127.7 | 72.7 | 86.4 | 95.1 |
| October | 81.3 | 130.1 | 70.2 | 87.3 | 94.6 |
| November | 82.9 | 130.4 | 80.3 | 87.8 | 98.4 |
| December | 81.2 | 120.8 | 92.0 | 85.7 | 99.6 |
| 2010 | |||||
| January | 83.6 | 113.8 | 90.3 | 82.0 | 100.9 |
| February | 82.4 | 127.1 | 98.0 | 81.4 | 94.6 |
| March | 83.6 | 131.8 | 89.6 | 87.6 | 94.5 |
| April | 83.8 | 135.1 | 87.2 | 85.8 | 91.4 |
| May | 85.4 | 144.8 | 97.8 | 87.9 | 94.4 |
| June | 85.3 | 145.7 | 94.3 | 87.8 | 98.3 |
| July | 86.1 | 140.3 | 94.2 | 89.8 | 95.2 |
| August | 88.4 | 136.5 | 88.7 | 90.0 | 93.7 |
| September | 87.3 | 131.9 | 81.0 | 80.1 | 96.9 |
| October | 86.6 | 139.0 | 92.8 | 82.6 | 84.0 |
| November | 86.7 | 148.9 | 92.9 | 87.7 | 89.1 |
| December | 88.4 | 153.5 | 97.6 | 87.6 | 92.0 |
| 2011 | |||||
| January | 88.4 | 146.5 | 89.1 | 97.8 | 88.0 |
| February | 86.3 | 148.5 | 88.9 | 102.6 | 87.6 |
| March | 87.6 | 146.8 | 104.3 | 99.2 | 88.6 |
| April | 88.1 | 151.6 | 101.8 | 95.2 | 89.9 |
| May | 86.9 | 135.6 | 102.8 | 94.5 | 78.8 |
| June | 85.4 | 145.7 | 103.2 | 96.5 | 83.3 |
| July | 87.7 | 151.0 | 105.1 | 100.9 | 84.0 |
| August | 89.5 | 154.0 | 123.7 | 106.1 | 86.7 |
| September | 89.9 | 155.4 | 123.9 | 106.2 | 95.1 |
| October | 89.1 | 151.4 | 124.1 | 106.2 | 91.1 |
| November | 87.9 | 151.7 | 123.7 | 104.0 | 89.3 |
| December | 88.0 | 153.1 | 120.6 | 105.7 | 88.4 |
| 2012 | |||||
| January | 87.9 | 159.9 | 121.2 | 111.1 | 87.1 |
| February | 86.0 | 156.4 | 123.7 | 109.6 | 90.3 |
| March | 85.1 | 145.7 | 127.9 | 109.4 | 86.8 |
| April | 84.8 | 155.0 | 118.7 | 113.7 | 90.9 |
| May | 82.4 | 162.0 | 110.3 | 116.3 | 87.5 |
| June | 79.6 | 158.9 | 110.0 | 116.0 | 86.5 |
| July | 78.0 | 160.8 | 104.6 | 114.8 | 91.0 |
| August | 76.5 | 160.3 | 102.6 | 114.1 | 90.1 |
| September | 76.6 | 158.9 | 106.3 | 111.1 | 90.1 |
| October | 80.9 | 161.4 | 102.4 | 105.5 | 93.7 |
| November | 83.7 | 155.6 | 105.0 | 110.0 | 92.2 |
| December | 82.1 | 163.5 | 104.9 | 115.0 | 93.4 |
| 2013 | |||||
| January | 83.0 | 162.6 | 111.9 | 116.4 | 94.3 |
| February | 83.9 | 161.9 | 116.3 | 117.1 | 89.5 |
| March | 84.7 | 166.4 | 109.7 | 121.3 | 91.9 |
| April | 84.1 | 161.8 | 109.5 | 117.6 | 91.1 |
| May | 86.2 | 154.5 | 104.7 | 115.6 | 80.5 |
| June | 87.0 | 159.6 | 100.2 | 115.8 | 93.8 |
| July | 88.2 | 163.0 | 105.9 | 115.8 | 88.8 |
| August | 88.4 | 172.6 | 111.6 | 119.9 | 91.5 |
| September | 88.7 | 168.8 | 113.4 | 122.4 | 95.9 |
| October | 86.9 | 173.3 | 116.6 | 127.0 | 87.2 |
| November | 86.7 | 178.6 | 109.4 | 126.1 | 91.4 |
| December | 87.8 | 177.7 | 105.7 | 119.7 | 87.3 |
| 2014 | |||||
| January | 87.7 | 175.9 | 121.2 | 123.5 | 86.7 |
| February | 88.8 | 175.7 | 125.5 | 125.3 | 91.7 |
| March | 88.7 | 179.5 | 130.7 | 127.8 | 82.1 |
| April | 88.6 | 182.1 | 138.5 | 127.6 | 87.7 |
| May | 89.6 | 183.1 | 135.5 | 132.1 | 89.8 |
| June | 91.3 | 186.2 | 129.6 | 134.3 | 94.3 |
| July | 90.3 | 180.2 | 122.1 | 133.5 | 90.4 |
| August | 86.8 | 178.3 | 113.4 | 134.0 | 90.1 |
| September | 89.8 | 188.1 | 114.7 | 135.1 | 85.9 |
| October | 90.6 | 195.0 | 115.3 | 136.4 | 86.1 |
| November | 90.6 | 186.4 | 117.3 | 136.7 | 89.0 |
| December | 89.1 | 184.4 | 114.3 | 137.1 | 87.5 |
| 2015 | |||||
| January | 89.9 | 195.4 | 91.4 | 133.7 | 88.2 |
| February | 89.0 | 203.4 | 75.0 | 134.9 | 87.7 |
| March | 87.4 | 196.4 | 65.2 | 133.7 | 91.2 |
| April | 86.8 | 186.2 | 75.7 | 143.7 | 87.1 |
| May | 84.5 | 188.3 | 84.4 | 140.5 | 90.2 |
| June | 85.0 | 198.3 | 88.2 | 140.4 | 87.8 |
| July | 85.5 | 208.6 | 84.3 | 148.6 | 86.7 |
| August | 86.3 | 207.5 | 85.1 | 151.8 | 86.2 |
| September | 87.1 | 191.7 | 77.9 | 150.0 | 86.9 |
| October | 85.3 | 198.9 | 78.9 | 143.4 | 87.0 |
| November | 86.8 | 204.1 | 79.4 | 149.6 | 84.8 |
| December | 86.8 | 203.5 | 78.8 | 152.2 | 90.0 |
| 2016 | |||||
| January | 87.8 | 205.8 | 81.8 | 160.5 | 92.2 |
| February | 87.3 | 203.4 | 78.7 | 156.0 | 89.3 |
| March | 86.9 | 200.3 | 67.2 | 151.8 | 91.8 |
| April | 87.7 | 188.9 | 66.8 | 147.3 | 100.0 |
| May | 88.9 | 147.0 | 66.2 | 143.0 | 84.5 |
| June | 89.0 | 168.3 | 65.5 | 141.3 | 90.7 |
| July | 89.4 | 197.4 | 64.5 | 146.9 | 98.1 |
| August | 90.0 | 199.5 | 66.8 | 151.2 | 95.4 |
| Source: Statistics Canada, CANSIM table 379-0031. | |||||
Establishments that provide support activities for mining and oil and gas extraction, including rigging and drilling services, reduced output during the first half of 2016 on consecutive declines from February to July. Output in this sector in August was 15% lower than at year end, and 52% lower than peak levels in April 2014. Crude oil and other pipeline transportation services edged down in the first half of 2016.
After gains in three of the first four months of 2016, the output of petroleum refineries fell 15.5% in May as the wildfires in Northern Alberta combined with maintenance and turnaround activities affected production. Refineries posted notable gains in June (+7.4%) and July (+8.1%). Overall, refinery output in August was 5.9% higher than at year end.
Part-time work led employment gains
Total employment increased by 44,000 (+0.2%) during the first six months of 2016 on private sector gains. Higher employment among core-age workers (those aged 25 to 54) and women accounted for much of the increase during the first half of the year (Chart 7). The employment rate (employed individuals expressed as a percentage of the working-age population) edged down during the first half of the year, averaging 61.1% from January to June. The unemployment rate was 6.8% in June, down from 7.2% at the start of the year.
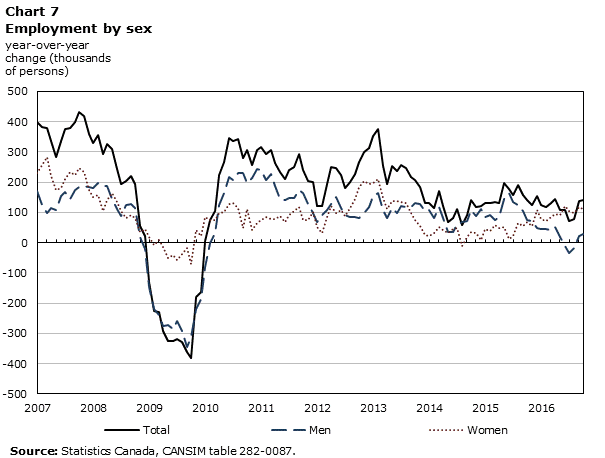
Data table for Chart 7
| Year | Total | Men | Women |
|---|---|---|---|
| year-over-year change (thousands of persons) | |||
| 2007 | |||
| January | 400.7 | 170.0 | 230.7 |
| February | 382.8 | 125.7 | 257.1 |
| March | 380.5 | 97.6 | 282.9 |
| April | 335.9 | 115.9 | 219.9 |
| May | 282.2 | 109.5 | 172.6 |
| June | 335.6 | 154.4 | 181.3 |
| July | 376.2 | 166.9 | 209.3 |
| August | 378.2 | 144.0 | 234.2 |
| September | 398.4 | 173.3 | 225.0 |
| October | 431.5 | 183.3 | 248.2 |
| November | 420.3 | 187.4 | 232.9 |
| December | 359.4 | 185.0 | 174.3 |
| 2008 | |||
| January | 331.3 | 181.8 | 149.5 |
| February | 355.6 | 197.3 | 158.3 |
| March | 292.1 | 188.8 | 103.2 |
| April | 326.7 | 187.2 | 139.7 |
| May | 308.6 | 142.9 | 165.8 |
| June | 244.6 | 109.9 | 134.7 |
| July | 193.1 | 89.5 | 103.6 |
| August | 204.2 | 123.6 | 80.7 |
| September | 220.5 | 129.3 | 91.3 |
| October | 193.5 | 113.4 | 80.1 |
| November | 55.7 | 19.6 | 36.1 |
| December | 21.3 | -22.4 | 43.8 |
| 2009 | |||
| January | -129.4 | -146.5 | 17.1 |
| February | -227.4 | -218.3 | -9.1 |
| March | -230.3 | -238.5 | 8.2 |
| April | -292.9 | -277.0 | -15.9 |
| May | -323.9 | -272.8 | -51.2 |
| June | -326.6 | -284.7 | -41.9 |
| July | -317.3 | -260.4 | -56.9 |
| August | -327.8 | -291.8 | -36.0 |
| September | -361.3 | -345.0 | -16.3 |
| October | -382.2 | -310.7 | -71.6 |
| November | -180.2 | -220.5 | 40.3 |
| December | -164.5 | -187.6 | 23.1 |
| 2010 | |||
| January | 4.9 | -81.2 | 86.1 |
| February | 74.7 | -1.6 | 76.3 |
| March | 105.4 | 32.1 | 73.3 |
| April | 225.1 | 126.1 | 98.9 |
| May | 266.0 | 164.2 | 101.9 |
| June | 345.6 | 217.5 | 128.1 |
| July | 336.3 | 206.2 | 130.1 |
| August | 342.3 | 228.9 | 113.3 |
| September | 279.1 | 229.5 | 49.6 |
| October | 306.8 | 196.9 | 110.0 |
| November | 257.4 | 215.2 | 42.2 |
| December | 307.9 | 243.5 | 64.4 |
| 2011 | |||
| January | 315.4 | 241.0 | 74.4 |
| February | 294.9 | 208.9 | 86.1 |
| March | 305.4 | 226.7 | 78.6 |
| April | 265.0 | 187.4 | 77.7 |
| May | 232.9 | 143.9 | 89.0 |
| June | 210.2 | 141.0 | 69.2 |
| July | 238.8 | 146.8 | 91.9 |
| August | 250.9 | 146.8 | 104.2 |
| September | 294.5 | 174.9 | 119.6 |
| October | 239.3 | 165.8 | 73.4 |
| November | 202.6 | 128.2 | 74.4 |
| December | 200.8 | 99.4 | 101.5 |
| 2012 | |||
| January | 121.9 | 68.5 | 53.4 |
| February | 122.9 | 91.6 | 31.1 |
| March | 194.0 | 107.8 | 86.3 |
| April | 250.7 | 128.9 | 121.7 |
| May | 246.7 | 149.5 | 97.2 |
| June | 222.6 | 116.1 | 106.5 |
| July | 179.2 | 91.0 | 88.3 |
| August | 200.6 | 86.2 | 114.5 |
| September | 227.3 | 84.3 | 143.0 |
| October | 266.7 | 81.5 | 185.2 |
| November | 301.4 | 98.7 | 202.7 |
| December | 312.1 | 116.9 | 195.1 |
| 2013 | |||
| January | 351.4 | 153.0 | 198.5 |
| February | 377.6 | 165.5 | 212.2 |
| March | 253.0 | 106.4 | 146.7 |
| April | 192.9 | 81.0 | 111.9 |
| May | 253.6 | 115.1 | 138.5 |
| June | 236.1 | 99.0 | 137.2 |
| July | 255.5 | 119.8 | 135.7 |
| August | 247.4 | 117.5 | 129.8 |
| September | 216.8 | 119.1 | 97.7 |
| October | 206.6 | 131.5 | 75.2 |
| November | 183.5 | 127.1 | 56.4 |
| December | 130.9 | 104.7 | 26.2 |
| 2014 | |||
| January | 131.8 | 108.4 | 23.3 |
| February | 114.4 | 83.2 | 31.2 |
| March | 170.2 | 117.7 | 52.4 |
| April | 121.8 | 80.6 | 41.2 |
| May | 67.6 | 34.8 | 32.8 |
| June | 81.9 | 36.8 | 45.0 |
| July | 110.8 | 61.2 | 49.6 |
| August | 57.2 | 68.8 | -11.6 |
| September | 90.4 | 71.9 | 18.5 |
| October | 140.8 | 106.5 | 34.3 |
| November | 119.4 | 86.6 | 32.9 |
| December | 120.1 | 112.2 | 7.9 |
| 2015 | |||
| January | 130.9 | 85.1 | 45.8 |
| February | 129.7 | 91.4 | 38.3 |
| March | 133.4 | 74.4 | 59.0 |
| April | 132.4 | 85.0 | 47.4 |
| May | 196.4 | 143.6 | 52.8 |
| June | 176.4 | 163.3 | 13.0 |
| July | 156.7 | 133.9 | 22.9 |
| August | 190.8 | 124.9 | 66.0 |
| September | 159.1 | 103.8 | 55.3 |
| October | 142.4 | 75.1 | 67.3 |
| November | 124.8 | 70.6 | 54.1 |
| December | 155.4 | 48.0 | 107.4 |
| 2016 | |||
| January | 125.5 | 45.9 | 79.6 |
| February | 117.9 | 46.6 | 71.3 |
| March | 129.6 | 43.5 | 86.1 |
| April | 144.0 | 50.4 | 93.6 |
| May | 108.5 | 17.6 | 90.9 |
| June | 107.6 | -12.1 | 119.8 |
| July | 71.4 | -33.9 | 105.2 |
| August | 77.4 | -19.2 | 96.5 |
| September | 138.8 | 20.8 | 118.0 |
| October | 139.6 | 29.9 | 109.8 |
| Source: Statistics Canada, CANSIM table 282-0087. | |||
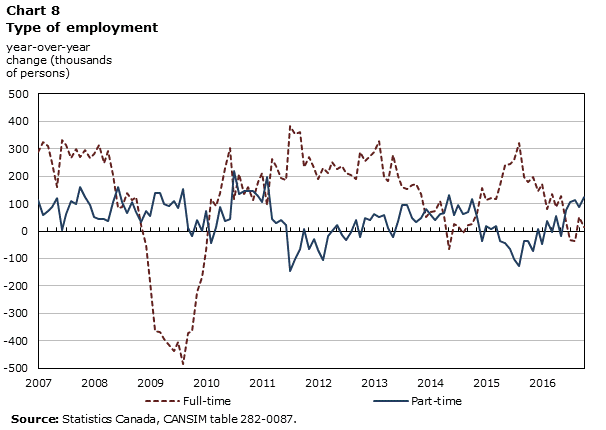
Part-time employment increased 37,000 in the first half of 2016 while full-time work was little changed (+7,000) (Chart 8). Employment in services rose by 125,000, led by gains in accommodation and food services and in information, cultural and recreation services. Employment in goods industries fell by 82,000 during the first six months of the year on declines in manufacturing (-52,000) and natural resources (-35,000).
Data table for Chart 8
| Year | Full-time | Part-time |
|---|---|---|
| year-over-year change (thousands of persons) | ||
| 2007 | ||
| January | 287.7 | 113.0 |
| February | 324.8 | 58.0 |
| March | 308.7 | 71.8 |
| April | 247.1 | 88.8 |
| May | 160.5 | 121.6 |
| June | 332.8 | 2.8 |
| July | 314.7 | 61.6 |
| August | 267.5 | 110.7 |
| September | 299.5 | 98.9 |
| October | 270.1 | 161.4 |
| November | 296.1 | 124.3 |
| December | 265.0 | 94.4 |
| 2008 | ||
| January | 279.7 | 51.6 |
| February | 311.5 | 44.1 |
| March | 249.1 | 43.0 |
| April | 289.7 | 37.1 |
| May | 204.1 | 104.5 |
| June | 83.2 | 161.4 |
| July | 86.0 | 107.2 |
| August | 139.9 | 64.3 |
| September | 114.5 | 106.1 |
| October | 124.7 | 68.9 |
| November | 23.2 | 32.5 |
| December | -50.2 | 71.5 |
| 2009 | ||
| January | -185.2 | 55.8 |
| February | -365.5 | 138.1 |
| March | -369.0 | 138.7 |
| April | -391.4 | 98.5 |
| May | -416.0 | 92.2 |
| June | -436.9 | 110.3 |
| July | -402.7 | 85.2 |
| August | -482.6 | 154.8 |
| September | -372.1 | 10.8 |
| October | -364.1 | -18.3 |
| November | -221.0 | 40.8 |
| December | -166.0 | 1.5 |
| 2010 | ||
| January | -67.4 | 72.3 |
| February | 118.4 | -43.7 |
| March | 89.3 | 16.1 |
| April | 138.3 | 86.7 |
| May | 230.7 | 35.2 |
| June | 303.0 | 42.6 |
| July | 118.4 | 218.0 |
| August | 206.9 | 135.4 |
| September | 134.8 | 144.3 |
| October | 159.5 | 147.3 |
| November | 113.6 | 143.9 |
| December | 180.3 | 127.5 |
| 2011 | ||
| January | 209.7 | 105.6 |
| February | 96.4 | 198.5 |
| March | 260.8 | 44.5 |
| April | 236.1 | 28.9 |
| May | 193.8 | 39.2 |
| June | 186.6 | 23.6 |
| July | 382.9 | -144.1 |
| August | 353.2 | -102.2 |
| September | 360.4 | -65.8 |
| October | 232.8 | 6.5 |
| November | 269.2 | -66.7 |
| December | 231.2 | -30.2 |
| 2012 | ||
| January | 190.4 | -68.5 |
| February | 229.0 | -106.1 |
| March | 212.3 | -18.2 |
| April | 250.8 | -0.1 |
| May | 225.5 | 21.2 |
| June | 237.4 | -14.8 |
| July | 213.0 | -33.9 |
| August | 203.5 | -2.9 |
| September | 188.4 | 38.8 |
| October | 288.2 | -21.4 |
| November | 253.4 | 48.0 |
| December | 273.2 | 38.8 |
| 2013 | ||
| January | 289.5 | 62.1 |
| February | 327.2 | 50.4 |
| March | 195.4 | 57.6 |
| April | 183.2 | 9.7 |
| May | 275.1 | -21.6 |
| June | 199.9 | 36.3 |
| July | 159.2 | 96.4 |
| August | 153.5 | 93.8 |
| September | 167.6 | 49.2 |
| October | 172.5 | 34.1 |
| November | 136.4 | 47.2 |
| December | 52.4 | 78.5 |
| 2014 | ||
| January | 70.9 | 60.7 |
| February | 73.6 | 40.8 |
| March | 109.2 | 61.0 |
| April | 55.5 | 66.3 |
| May | -63.9 | 131.6 |
| June | 25.1 | 56.7 |
| July | 17.1 | 93.6 |
| August | -5.8 | 63.0 |
| September | 20.5 | 69.9 |
| October | 24.7 | 116.1 |
| November | 66.9 | 52.5 |
| December | 156.3 | -36.2 |
| 2015 | ||
| January | 114.2 | 16.7 |
| February | 120.9 | 8.8 |
| March | 116.7 | 16.7 |
| April | 167.5 | -35.1 |
| May | 240.3 | -43.9 |
| June | 243.4 | -67.1 |
| July | 258.2 | -101.4 |
| August | 318.9 | -128.1 |
| September | 195.7 | -36.6 |
| October | 178.7 | -36.2 |
| November | 197.8 | -73.1 |
| December | 147.4 | 8.0 |
| 2016 | ||
| January | 171.5 | -45.9 |
| February | 81.6 | 36.3 |
| March | 133.7 | -4.1 |
| April | 88.2 | 55.9 |
| May | 127.0 | -18.5 |
| June | 31.2 | 76.5 |
| July | -33.1 | 104.5 |
| August | -35.7 | 113.1 |
| September | 50.2 | 88.5 |
| October | 15.5 | 124.0 |
| Sources: Statistics Canada, CANSIM tables 282-0087. | ||
Gains from December to June were concentrated in British Columbia (+45,000) and Ontario (+37,000), while employment in Alberta fell by 37,000 (Chart 9). The unemployment rate in British Columbia declined during the first half of the year, reaching 5.9% in June. The unemployment rate in Quebec and Ontario also decreased, to 7.0% and 6.4% in June.
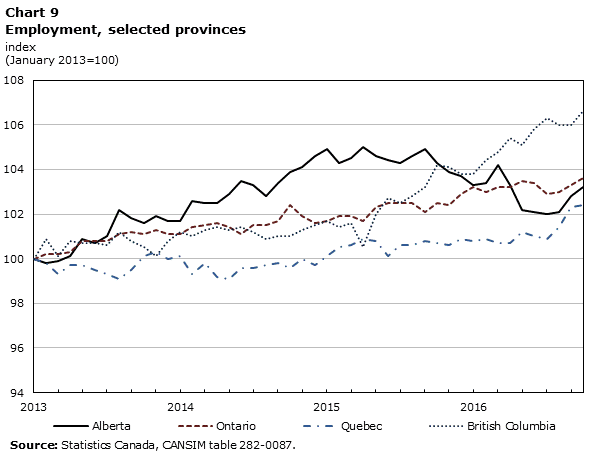
Data table for Chart 9
| Year | Alberta | Ontario | Quebec | British Columbia |
|---|---|---|---|---|
| index (January 2013=100) | ||||
| 2013 | ||||
| January | 100.0 | 100.0 | 100.0 | 100.0 |
| February | 99.8 | 100.2 | 99.8 | 100.9 |
| March | 99.9 | 100.2 | 99.3 | 100.1 |
| April | 100.1 | 100.3 | 99.7 | 100.8 |
| May | 100.9 | 100.8 | 99.7 | 100.7 |
| June | 100.7 | 100.8 | 99.5 | 100.7 |
| July | 101.0 | 100.8 | 99.3 | 100.6 |
| August | 102.2 | 101.1 | 99.1 | 101.2 |
| September | 101.8 | 101.2 | 99.5 | 100.8 |
| October | 101.6 | 101.1 | 100.1 | 100.5 |
| November | 101.9 | 101.3 | 100.3 | 100.1 |
| December | 101.7 | 101.1 | 100.0 | 100.8 |
| 2014 | ||||
| January | 101.7 | 101.1 | 100.1 | 101.2 |
| February | 102.6 | 101.4 | 99.3 | 101.0 |
| March | 102.5 | 101.5 | 99.8 | 101.3 |
| April | 102.5 | 101.6 | 99.2 | 101.4 |
| May | 102.9 | 101.4 | 99.1 | 101.3 |
| June | 103.5 | 101.1 | 99.6 | 101.4 |
| July | 103.3 | 101.5 | 99.6 | 101.2 |
| August | 102.8 | 101.5 | 99.7 | 100.9 |
| September | 103.4 | 101.7 | 99.8 | 101.0 |
| October | 103.9 | 102.4 | 99.6 | 101.0 |
| November | 104.1 | 101.9 | 100.0 | 101.3 |
| December | 104.6 | 101.6 | 99.7 | 101.5 |
| 2015 | ||||
| January | 104.9 | 101.7 | 100.1 | 101.7 |
| February | 104.3 | 101.9 | 100.5 | 101.4 |
| March | 104.5 | 101.9 | 100.6 | 101.6 |
| April | 105.0 | 101.7 | 100.9 | 100.5 |
| May | 104.6 | 102.3 | 100.8 | 102.0 |
| June | 104.4 | 102.5 | 100.1 | 102.7 |
| July | 104.3 | 102.5 | 100.6 | 102.5 |
| August | 104.6 | 102.5 | 100.6 | 102.8 |
| September | 104.9 | 102.1 | 100.8 | 103.2 |
| October | 104.3 | 102.5 | 100.7 | 104.2 |
| November | 103.9 | 102.4 | 100.6 | 104.1 |
| December | 103.7 | 102.9 | 100.9 | 103.8 |
| 2016 | ||||
| January | 103.3 | 103.2 | 100.8 | 103.8 |
| February | 103.4 | 103.0 | 100.9 | 104.4 |
| March | 104.2 | 103.2 | 100.7 | 104.8 |
| April | 103.3 | 103.2 | 100.7 | 105.4 |
| May | 102.2 | 103.5 | 101.2 | 105.1 |
| June | 102.1 | 103.4 | 101.0 | 105.8 |
| July | 102.0 | 102.9 | 100.9 | 106.3 |
| August | 102.1 | 103.0 | 101.4 | 106.0 |
| September | 102.8 | 103.3 | 102.3 | 106.0 |
| October | 103.2 | 103.6 | 102.4 | 106.6 |
| Source: Statistics Canada, CANSIM table 282-0087. | ||||
More recently, employment rose 62,000 in the third quarter, bringing the net increase during the first nine months of 2016 to 106,000. Gains in part-time work, among older workers, and in Quebec led the third-quarter increase. The unemployment rate for Canada as a whole stood at 7.0% in August and September, after edging below 7% from May to July. Employment rose 44,000 in October on gains in part-time work.
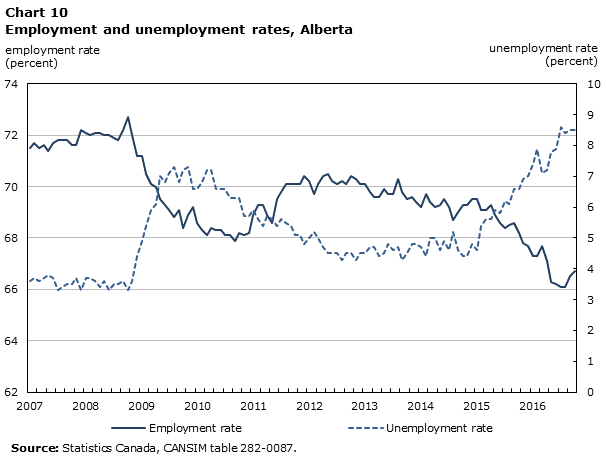
Labour market conditions in Alberta
Labour market conditions in Alberta deteriorated markedly since oil prices began to decline in mid-2014. Total employment in Alberta declined by 33,000 since the end of 2014 when unemployment in the province was below 5 percent. Losses in full-time work over this 21-month period totalled 91,000. Overall employment in goods industries in Alberta was down 84,000 during this period on losses in natural resources and manufacturing. Since the end of 2014, losses in both of these sectors were about 30,000 each.Note 5
The province’s unemployment rate rose above the 8% mark during the summer of 2016, averaging 8.5% from July to September (Chart 10). This marks the first time that the unemployment rate in the province has risen above 8% since mid-1995. In October 2016, the unemployment rate among core-aged individuals was 7.4%, up from 3.9% at the start of 2015.
Data table for Chart 10
| Year | Employment rate | Unemployment rate |
|---|---|---|
| percent | ||
| 2007 | ||
| January | 71.5 | 3.6 |
| February | 71.7 | 3.7 |
| March | 71.5 | 3.6 |
| April | 71.6 | 3.7 |
| May | 71.4 | 3.8 |
| June | 71.7 | 3.7 |
| July | 71.8 | 3.3 |
| August | 71.8 | 3.4 |
| September | 71.8 | 3.5 |
| October | 71.6 | 3.5 |
| November | 71.6 | 3.7 |
| December | 72.2 | 3.3 |
| 2008 | ||
| January | 72.1 | 3.7 |
| February | 72.0 | 3.7 |
| March | 72.1 | 3.6 |
| April | 72.1 | 3.4 |
| May | 72.0 | 3.6 |
| June | 72.0 | 3.3 |
| July | 71.9 | 3.5 |
| August | 71.8 | 3.5 |
| September | 72.2 | 3.6 |
| October | 72.7 | 3.3 |
| November | 72.0 | 3.6 |
| December | 71.2 | 4.4 |
| 2009 | ||
| January | 71.2 | 4.9 |
| February | 70.5 | 5.4 |
| March | 70.1 | 5.9 |
| April | 70.0 | 6.1 |
| May | 69.5 | 7.0 |
| June | 69.3 | 6.8 |
| July | 69.1 | 7.1 |
| August | 68.8 | 7.3 |
| September | 69.1 | 6.8 |
| October | 68.4 | 7.2 |
| November | 68.9 | 7.3 |
| December | 69.2 | 6.6 |
| 2010 | ||
| January | 68.6 | 6.6 |
| February | 68.3 | 6.8 |
| March | 68.1 | 7.2 |
| April | 68.4 | 7.2 |
| May | 68.3 | 6.6 |
| June | 68.3 | 6.6 |
| July | 68.1 | 6.6 |
| August | 68.1 | 6.3 |
| September | 67.9 | 6.3 |
| October | 68.2 | 6.3 |
| November | 68.1 | 5.7 |
| December | 68.2 | 5.7 |
| 2011 | ||
| January | 68.9 | 5.9 |
| February | 69.3 | 5.6 |
| March | 69.3 | 5.4 |
| April | 68.9 | 5.7 |
| May | 68.6 | 5.6 |
| June | 69.5 | 5.4 |
| July | 69.8 | 5.6 |
| August | 70.1 | 5.5 |
| September | 70.1 | 5.4 |
| October | 70.1 | 5.1 |
| November | 70.1 | 5.1 |
| December | 70.4 | 4.8 |
| 2012 | ||
| January | 70.2 | 5.0 |
| February | 69.7 | 5.2 |
| March | 70.1 | 5.0 |
| April | 70.4 | 4.7 |
| May | 70.5 | 4.5 |
| June | 70.2 | 4.5 |
| July | 70.1 | 4.5 |
| August | 70.2 | 4.3 |
| September | 70.1 | 4.5 |
| October | 70.4 | 4.5 |
| November | 70.3 | 4.3 |
| December | 70.1 | 4.5 |
| 2013 | ||
| January | 70.1 | 4.5 |
| February | 69.8 | 4.7 |
| March | 69.6 | 4.7 |
| April | 69.6 | 4.4 |
| May | 69.9 | 4.5 |
| June | 69.7 | 4.8 |
| July | 69.7 | 4.6 |
| August | 70.3 | 4.7 |
| September | 69.8 | 4.3 |
| October | 69.5 | 4.5 |
| November | 69.6 | 4.8 |
| December | 69.4 | 4.8 |
| 2014 | ||
| January | 69.2 | 4.7 |
| February | 69.7 | 4.4 |
| March | 69.4 | 5.0 |
| April | 69.2 | 5.0 |
| May | 69.3 | 4.6 |
| June | 69.5 | 4.9 |
| July | 69.2 | 4.6 |
| August | 68.7 | 5.2 |
| September | 69.0 | 4.6 |
| October | 69.3 | 4.4 |
| November | 69.3 | 4.4 |
| December | 69.5 | 4.8 |
| 2015 | ||
| January | 69.5 | 4.6 |
| February | 69.1 | 5.4 |
| March | 69.1 | 5.6 |
| April | 69.3 | 5.6 |
| May | 68.9 | 5.9 |
| June | 68.6 | 5.8 |
| July | 68.4 | 6.2 |
| August | 68.5 | 6.1 |
| September | 68.6 | 6.6 |
| October | 68.2 | 6.6 |
| November | 67.8 | 6.9 |
| December | 67.7 | 7.0 |
| 2016 | ||
| January | 67.3 | 7.4 |
| February | 67.3 | 7.9 |
| March | 67.7 | 7.1 |
| April | 67.1 | 7.2 |
| May | 66.3 | 7.8 |
| June | 66.2 | 7.9 |
| July | 66.1 | 8.6 |
| August | 66.1 | 8.4 |
| September | 66.5 | 8.5 |
| October | 66.7 | 8.5 |
| Sources: Statistics Canada, CANSIM tables 282-0087. | ||
The employment rate in Alberta has trended lower since early 2015, edging below 67% in recent months. This overall decline reflects lower age-specific rates within the province’s working-age population.Note 6 From January 2015 to October 2016, the employment rate among people aged 25 to 54 fell 3.1 percentage points, from 84.4% to 81.3%. It fell 2.6 percentage points among youth aged 15 to 24, to 60.0%. Among individuals aged 55 and over, the employment rate declined 1.5 percentage points to 42.6%. Despite these recent declines, the overall employment rate in Alberta remains about 5 percentage points higher than in Ontario, Quebec and British Columbia.Note 7
Average weekly earnings in Alberta, measured year-over-year, continued to trend downward in early 2016, largely reflecting lower earnings and employment in resource extraction and in professional, scientific and technical services. The change in average weekly earnings in Alberta, measured year-over-year, has been negative since mid-2015, and has contributed to slower wage growth for Canada as a whole. Despite these declines, average payroll earnings in Alberta, in level terms, remained 17% higher in August 2016 than the national average, albeit down from 23% at the start of 2015.Note 8
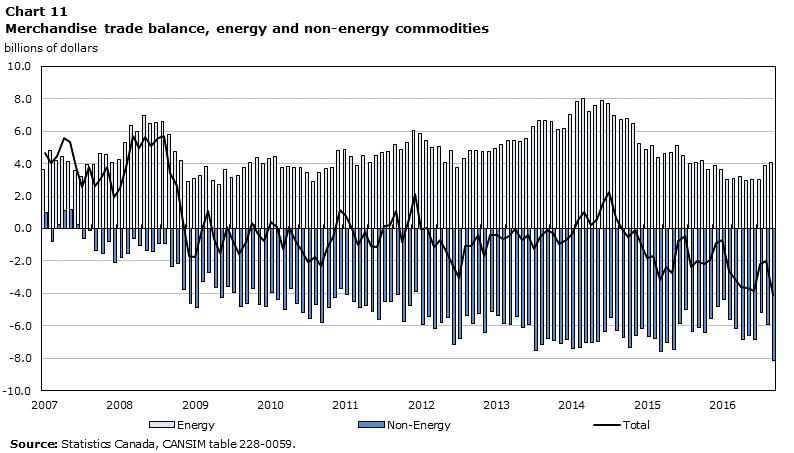
Widening trade deficits as exports trended lower in the first half of 2016
Canada’s merchandise trade deficit widened in the first half of 2016, reaching $3.9 billion in June (Chart 11). Lower exports to Asia contributed to trade deficits early in the year, while declines to the United States and the United Kingdom bolstered deficits during the spring.
Data table for Chart 11
| Year | Total | Energy | Non-Energy |
|---|---|---|---|
| billions of dollars | |||
| 2007 | |||
| January | 4,647.9 | 3,661.8 | 986.1 |
| February | 4,037.6 | 4,812.4 | -774.8 |
| March | 4,441.1 | 4,193.0 | 248.1 |
| April | 5,570.9 | 4,438.5 | 1,132.4 |
| May | 5,337.1 | 4,136.4 | 1,200.7 |
| June | 3,770.9 | 3,548.1 | 222.8 |
| July | 2,559.8 | 3,207.4 | -647.6 |
| August | 3,788.6 | 3,916.3 | -127.7 |
| September | 2,612.9 | 3,965.4 | -1,352.5 |
| October | 3,092.5 | 4,618.3 | -1,525.8 |
| November | 3,773.7 | 4,567.6 | -793.9 |
| December | 1,961.5 | 4,089.5 | -2,128.0 |
| 2008 | |||
| January | 2,484.8 | 4,284.3 | -1,799.5 |
| February | 3,784.1 | 5,327.5 | -1,543.4 |
| March | 5,727.2 | 6,351.2 | -624.0 |
| April | 4,976.0 | 6,000.4 | -1,024.4 |
| May | 5,623.7 | 6,998.3 | -1,374.6 |
| June | 5,060.8 | 6,496.8 | -1,436.0 |
| July | 5,592.2 | 6,548.1 | -955.9 |
| August | 5,679.9 | 6,605.1 | -925.2 |
| September | 3,447.8 | 5,803.9 | -2,356.1 |
| October | 2,610.1 | 4,741.2 | -2,131.1 |
| November | 386.6 | 4,169.8 | -3,783.2 |
| December | -1,703.6 | 2,902.7 | -4,606.3 |
| 2009 | |||
| January | -1,767.1 | 3,093.6 | -4,860.7 |
| February | -44.7 | 3,250.4 | -3,295.1 |
| March | 1,079.3 | 3,801.7 | -2,722.4 |
| April | -676.2 | 2,969.5 | -3,645.7 |
| May | -1,543.6 | 2,700.0 | -4,243.6 |
| June | 97.3 | 3,649.4 | -3,552.1 |
| July | -782.4 | 3,160.4 | -3,942.8 |
| August | -1,561.3 | 3,269.5 | -4,830.8 |
| September | -821.4 | 3,775.6 | -4,597.0 |
| October | 360.0 | 4,086.1 | -3,726.1 |
| November | -334.5 | 4,354.9 | -4,689.4 |
| December | -778.8 | 4,014.9 | -4,793.7 |
| 2010 | |||
| January | 394.0 | 4,346.7 | -3,952.7 |
| February | 61.2 | 4,467.2 | -4,406.0 |
| March | -1,255.8 | 3,732.8 | -4,988.6 |
| April | 109.6 | 3,842.6 | -3,733.0 |
| May | -860.2 | 3,779.8 | -4,640.0 |
| June | -1,396.2 | 3,765.0 | -5,161.2 |
| July | -2,071.0 | 3,452.0 | -5,523.0 |
| August | -1,771.5 | 2,890.1 | -4,661.6 |
| September | -2,333.8 | 3,439.4 | -5,773.2 |
| October | -1,182.5 | 3,685.1 | -4,867.6 |
| November | -512.8 | 3,775.6 | -4,288.4 |
| December | 1,115.7 | 4,789.2 | -3,673.5 |
| 2011 | |||
| January | 744.1 | 4,842.6 | -4,098.5 |
| February | -48.5 | 4,431.9 | -4,480.4 |
| March | -999.5 | 3,881.3 | -4,880.8 |
| April | -239.7 | 4,494.0 | -4,733.7 |
| May | -1,086.0 | 4,053.7 | -5,139.7 |
| June | -1,114.5 | 4,526.6 | -5,641.1 |
| July | 148.8 | 4,678.2 | -4,529.4 |
| August | 208.8 | 4,744.0 | -4,535.2 |
| September | 1,097.8 | 5,199.1 | -4,101.3 |
| October | -840.1 | 4,877.8 | -5,717.9 |
| November | 575.3 | 5,305.7 | -4,730.4 |
| December | 2,121.1 | 6,015.9 | -3,894.8 |
| 2012 | |||
| January | -34.7 | 5,887.1 | -5,921.8 |
| February | -1.0 | 5,450.7 | -5,451.7 |
| March | -1,162.1 | 5,013.9 | -6,176.0 |
| April | -740.9 | 5,081.4 | -5,822.3 |
| May | -1,386.6 | 4,092.9 | -5,479.5 |
| June | -2,337.8 | 4,804.3 | -7,142.1 |
| July | -3,042.0 | 3,771.5 | -6,813.5 |
| August | -1,076.3 | 4,301.2 | -5,377.5 |
| September | -1,051.1 | 4,810.8 | -5,861.9 |
| October | -379.3 | 4,837.1 | -5,216.4 |
| November | -1,673.3 | 4,729.1 | -6,402.4 |
| December | -404.0 | 4,718.1 | -5,122.1 |
| 2013 | |||
| January | -432.2 | 4,922.4 | -5,354.6 |
| February | -669.9 | 5,176.3 | -5,846.2 |
| March | -471.1 | 5,425.9 | -5,897.0 |
| April | -2.1 | 5,454.3 | -5,456.4 |
| May | -716.0 | 5,374.8 | -6,090.8 |
| June | -414.0 | 5,527.2 | -5,941.2 |
| July | -1,257.2 | 6,278.5 | -7,535.7 |
| August | -502.8 | 6,652.1 | -7,154.9 |
| September | -109.7 | 6,654.8 | -6,764.5 |
| October | -300.7 | 6,618.1 | -6,918.8 |
| November | -979.9 | 6,129.7 | -7,109.6 |
| December | -706.4 | 6,141.4 | -6,847.8 |
| 2014 | |||
| January | -363.1 | 7,059.1 | -7,422.2 |
| February | 522.5 | 7,851.4 | -7,328.9 |
| March | 1,015.2 | 8,033.8 | -7,018.6 |
| April | 187.7 | 7,209.3 | -7,021.6 |
| May | 594.5 | 7,587.4 | -6,992.9 |
| June | 1,548.9 | 7,879.2 | -6,330.3 |
| July | 2,230.5 | 7,726.4 | -5,495.9 |
| August | 645.5 | 6,950.1 | -6,304.6 |
| September | -9.1 | 6,731.9 | -6,741.0 |
| October | -530.2 | 6,814.1 | -7,344.3 |
| November | -84.8 | 6,490.3 | -6,575.1 |
| December | -966.5 | 5,210.7 | -6,177.2 |
| 2015 | |||
| January | -1,803.0 | 4,875.2 | -6,678.2 |
| February | -1,680.0 | 5,101.6 | -6,781.6 |
| March | -3,174.4 | 4,397.6 | -7,572.0 |
| April | -2,383.8 | 4,645.2 | -7,029.0 |
| May | -2,762.4 | 4,714.5 | -7,476.9 |
| June | -760.8 | 5,106.3 | -5,867.1 |
| July | -478.7 | 4,492.9 | -4,971.6 |
| August | -2,356.0 | 3,987.2 | -6,343.2 |
| September | -2,026.1 | 4,061.8 | -6,087.9 |
| October | -2,206.4 | 4,186.2 | -6,392.6 |
| November | -1,932.5 | 3,610.4 | -5,542.9 |
| December | -896.2 | 3,888.5 | -4,784.7 |
| 2016 | |||
| January | -731.3 | 3,651.2 | -4,382.5 |
| February | -2,641.4 | 3,000.2 | -5,641.6 |
| March | -3,110.4 | 3,052.3 | -6,162.7 |
| April | -3,629.1 | 3,221.8 | -6,850.9 |
| May | -3,666.2 | 2,952.2 | -6,618.4 |
| June | -3,854.1 | 3,005.3 | -6,859.4 |
| July | -2,161.3 | 3,014.0 | -5,175.3 |
| August | -1,991.5 | 3,902.5 | -5,894.0 |
| September | -4,080.4 | 4,075.0 | -8,155.4 |
| Source: Statistics Canada, CANSIM table 228-0059. | |||
Smaller surpluses for energy were primarily responsible for larger trade deficits in the first half of the year. Energy exports, on lower prices and volumes, were 20.3% lower in first half of 2016 than in the second half of 2015. The volume of energy exports, measured in chained 2007 dollars, declined from February to June.
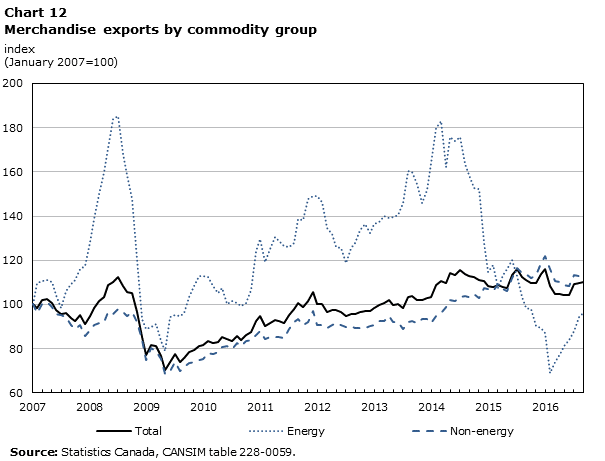
Non-energy exports also slowed during the first half of 2016, declining from February to June (Chart 12). Total non-energy exports were 1.9% lower in the first half of 2016 than in the last half of 2015. Exports of metal ores and non-metallic mineral products fell 16.6%, on declines in potash. Exports of aircraft and other transportation equipment and parts fell 9.2%. Lower exports of metal and non-metallic mineral products (-2.6%), industrial machinery, equipment and parts (-3.6%) and consumer goods (-1.4%) also contributed to the decline. Lower non-energy exports during the first half of the year coincided with declines in private fixed investment spending in the United States.Note 9
Data table for Chart 12
| Year | Total | Energy | Non-Energy |
|---|---|---|---|
| index (January 2007=100) | |||
| 2007 | |||
| January | 100.0 | 100.0 | 100.0 |
| February | 98.3 | 109.9 | 96.0 |
| March | 102.1 | 110.4 | 100.4 |
| April | 102.6 | 111.0 | 100.9 |
| May | 100.6 | 110.0 | 98.7 |
| June | 97.3 | 104.4 | 95.9 |
| July | 95.9 | 98.3 | 95.4 |
| August | 96.1 | 106.0 | 94.2 |
| September | 93.7 | 109.3 | 90.6 |
| October | 92.5 | 111.1 | 88.9 |
| November | 95.1 | 115.9 | 90.9 |
| December | 91.0 | 117.4 | 85.8 |
| 2008 | |||
| January | 95.0 | 128.2 | 88.4 |
| February | 98.5 | 138.8 | 90.5 |
| March | 101.4 | 150.2 | 91.7 |
| April | 103.2 | 159.9 | 92.0 |
| May | 108.7 | 170.9 | 96.4 |
| June | 110.3 | 184.0 | 95.7 |
| July | 112.5 | 185.3 | 98.1 |
| August | 108.4 | 168.2 | 96.6 |
| September | 105.5 | 158.8 | 94.9 |
| October | 105.2 | 147.6 | 96.8 |
| November | 96.7 | 120.3 | 92.0 |
| December | 85.3 | 93.5 | 83.7 |
| 2009 | |||
| January | 77.2 | 88.9 | 74.8 |
| February | 81.7 | 89.9 | 80.1 |
| March | 81.0 | 91.3 | 78.9 |
| April | 76.6 | 83.6 | 75.2 |
| May | 70.3 | 79.0 | 68.5 |
| June | 74.1 | 94.4 | 70.0 |
| July | 77.6 | 95.2 | 74.1 |
| August | 74.0 | 94.7 | 69.9 |
| September | 75.9 | 96.2 | 71.9 |
| October | 78.4 | 103.5 | 73.4 |
| November | 79.6 | 108.5 | 73.9 |
| December | 81.1 | 113.0 | 74.8 |
| 2010 | |||
| January | 81.7 | 113.1 | 75.5 |
| February | 83.6 | 112.3 | 77.9 |
| March | 82.6 | 108.2 | 77.6 |
| April | 83.1 | 105.0 | 78.7 |
| May | 85.2 | 107.4 | 80.8 |
| June | 84.3 | 100.2 | 81.2 |
| July | 83.5 | 101.6 | 79.9 |
| August | 85.7 | 100.8 | 82.7 |
| September | 84.0 | 99.1 | 81.1 |
| October | 86.4 | 100.5 | 83.6 |
| November | 87.7 | 106.6 | 84.0 |
| December | 92.3 | 124.2 | 86.0 |
| 2011 | |||
| January | 94.8 | 129.6 | 87.9 |
| February | 90.1 | 119.3 | 84.3 |
| March | 91.8 | 125.1 | 85.2 |
| April | 93.0 | 130.5 | 85.5 |
| May | 92.6 | 128.7 | 85.4 |
| June | 91.7 | 126.4 | 84.8 |
| July | 95.1 | 126.1 | 89.0 |
| August | 97.8 | 127.6 | 91.9 |
| September | 100.7 | 138.8 | 93.2 |
| October | 98.7 | 138.1 | 90.9 |
| November | 101.4 | 147.7 | 92.2 |
| December | 105.6 | 149.3 | 96.9 |
| 2012 | |||
| January | 100.2 | 149.0 | 90.5 |
| February | 100.0 | 146.3 | 90.9 |
| March | 96.8 | 134.7 | 89.3 |
| April | 97.4 | 131.9 | 90.6 |
| May | 97.3 | 126.1 | 91.6 |
| June | 96.4 | 125.4 | 90.7 |
| July | 94.7 | 118.8 | 90.0 |
| August | 95.9 | 125.7 | 90.1 |
| September | 95.6 | 127.7 | 89.3 |
| October | 96.7 | 133.5 | 89.4 |
| November | 97.2 | 136.3 | 89.4 |
| December | 97.2 | 132.3 | 90.2 |
| 2013 | |||
| January | 98.3 | 136.2 | 90.8 |
| February | 99.7 | 137.1 | 92.3 |
| March | 100.5 | 140.0 | 92.7 |
| April | 102.0 | 139.1 | 94.7 |
| May | 99.8 | 139.5 | 92.0 |
| June | 100.1 | 140.5 | 92.2 |
| July | 98.4 | 145.9 | 89.0 |
| August | 103.3 | 160.5 | 92.0 |
| September | 103.8 | 160.1 | 92.7 |
| October | 102.0 | 154.7 | 91.5 |
| November | 102.0 | 146.1 | 93.3 |
| December | 102.9 | 151.6 | 93.3 |
| 2014 | |||
| January | 103.4 | 164.0 | 91.4 |
| February | 108.8 | 179.7 | 94.8 |
| March | 110.5 | 183.2 | 96.1 |
| April | 109.5 | 162.3 | 99.0 |
| May | 114.2 | 175.6 | 102.0 |
| June | 113.4 | 174.0 | 101.5 |
| July | 115.4 | 176.0 | 103.4 |
| August | 113.6 | 163.5 | 103.7 |
| September | 112.7 | 158.5 | 103.6 |
| October | 112.5 | 152.5 | 104.6 |
| November | 111.0 | 152.1 | 102.8 |
| December | 110.7 | 128.0 | 107.3 |
| 2015 | |||
| January | 108.3 | 114.6 | 107.1 |
| February | 107.9 | 117.9 | 105.9 |
| March | 108.8 | 107.6 | 109.1 |
| April | 108.0 | 113.5 | 107.0 |
| May | 107.6 | 116.0 | 105.9 |
| June | 113.2 | 120.3 | 111.8 |
| July | 116.0 | 112.9 | 116.6 |
| August | 112.5 | 103.4 | 114.3 |
| September | 111.3 | 98.3 | 113.9 |
| October | 109.5 | 97.8 | 111.8 |
| November | 109.7 | 90.3 | 113.5 |
| December | 113.8 | 89.5 | 118.6 |
| 2016 | |||
| January | 116.1 | 86.9 | 121.8 |
| February | 108.3 | 68.8 | 116.1 |
| March | 104.6 | 74.0 | 110.6 |
| April | 104.8 | 77.4 | 110.2 |
| May | 104.1 | 81.2 | 108.7 |
| June | 104.4 | 83.8 | 108.5 |
| July | 109.2 | 88.0 | 113.4 |
| August | 109.9 | 94.5 | 112.9 |
| September | 110.0 | 96.2 | 112.7 |
| Source: Statistics Canada, CANSIM table 228-0059. | |||
Declines in non-energy exports followed notable gains in late 2015, supported by motor vehicles. Despite declines from February to June, total automotive exports were 3.3% higher in the first half of 2016 than in the second half of 2015.
Canada’s trade balance improved in July, as non-energy exports strengthened. Energy exports increased in both July and August, supported by higher volumes. The trade deficit narrowed to $2.0 billion in August, as exports to the United Kingdom and China increased. In September, the trade deficit widened to a record $4.1 billion, reflecting a high-value import of industrial machinery, equipment and parts from South Korea for the Hebron offshore oil project. Exports of energy products increased in September, while non-energy exports edged down.
Lower petroleum sales in the first half partly offset by auto shipments
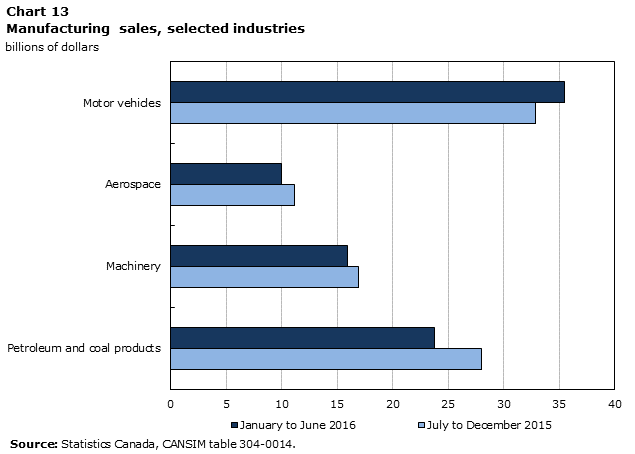
Total manufacturing sales were 1.2% lower in the first half of 2016 than in the second half of 2015. Sales of petroleum and coal products continued to decline, falling to about half of early 2014 levels in the first quarter. Declines in aerospace products and machinery also contributed to lower sales. These declines coincided with lower exports and weaker private fixed investment in the United States.
Sales of motor vehicle manufacturers during the first half of the year continued to offset price-related declines in petroleum manufacturing (Chart 13). Motor vehicle sales were 7.8% higher in the first half of the year, following a 16.4% increase in the last half of 2015. While auto shipments remained high compared to 2015, sales trended downward following the recent peak in January. Sales fell markedly in May due to supply disruptions related to an earthquake in Japan.
Data table for Chart 13
| Industries | Petroleum and coal products | Machinery | Aerospace | Motor vehicles |
|---|---|---|---|---|
| billions fo dollars | ||||
| July to December 2015 | 28.0 | 16.9 | 11.2 | 32.9 |
| January to June 2016 | 23.8 | 15.9 | 10.0 | 35.5 |
| Source: Statistics Canada, CANSIM table 304-0014. | ||||
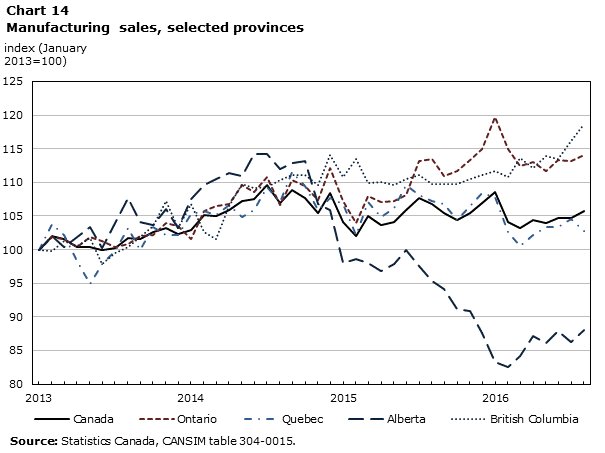
On a provincial basis, lower sales in Alberta and Quebec during the first half of 2016 were offset by higher manufacturing sales in Ontario and British Columbia (Chart 14). Manufacturing shipments in Alberta were 8.2% lower in the first half than in the second half of 2015, reflecting declines in petroleum and coal products. While sales in the province have trended downward since late 2014, they edged up during the winter months as petroleum and chemicals posted gains. In Ontario, manufacturing sales trended lower in the first half after auto shipments supported the peak in sales at the start of the year. Manufacturing sales in Quebec have declined from late 2015 levels, reflecting lower production of aerospace products and parts.
Data table for Chart 14
| Year | Canada | Ontario | Quebec | Alberta | British Columbia |
|---|---|---|---|---|---|
| index (January 2013=100) | |||||
| 2013 | |||||
| January | 100.00 | 100.00 | 100.00 | 100.00 | 100.00 |
| February | 102.00 | 101.82 | 103.74 | 101.99 | 99.78 |
| March | 101.51 | 101.62 | 102.18 | 100.41 | 101.28 |
| April | 100.32 | 100.44 | 98.32 | 101.91 | 100.51 |
| May | 100.36 | 101.89 | 94.84 | 103.39 | 101.68 |
| June | 99.99 | 101.32 | 97.88 | 100.21 | 97.86 |
| July | 100.16 | 100.32 | 99.80 | 103.98 | 99.52 |
| August | 101.76 | 100.88 | 103.23 | 107.65 | 100.34 |
| September | 101.59 | 102.06 | 99.88 | 104.15 | 101.86 |
| October | 102.65 | 102.11 | 103.30 | 103.65 | 103.56 |
| November | 103.27 | 103.93 | 102.10 | 106.03 | 107.15 |
| December | 102.36 | 103.49 | 102.15 | 103.16 | 103.27 |
| 2014 | |||||
| January | 102.89 | 101.63 | 105.24 | 107.55 | 106.75 |
| February | 105.14 | 105.72 | 105.69 | 109.65 | 102.63 |
| March | 104.92 | 106.41 | 105.12 | 110.50 | 101.55 |
| April | 105.90 | 106.72 | 106.65 | 111.45 | 106.53 |
| May | 107.17 | 109.54 | 104.86 | 110.97 | 109.79 |
| June | 107.52 | 108.51 | 105.91 | 114.18 | 109.17 |
| July | 109.64 | 110.81 | 109.31 | 114.27 | 109.27 |
| August | 106.91 | 106.69 | 107.05 | 112.02 | 110.28 |
| September | 108.86 | 110.29 | 111.60 | 112.81 | 111.09 |
| October | 107.73 | 109.41 | 109.38 | 113.18 | 111.15 |
| November | 105.46 | 107.40 | 105.88 | 106.81 | 109.55 |
| December | 108.36 | 112.10 | 107.68 | 105.94 | 114.07 |
| 2015 | |||||
| January | 104.10 | 107.24 | 106.75 | 97.95 | 110.81 |
| February | 101.96 | 103.97 | 102.10 | 98.63 | 113.45 |
| March | 105.04 | 107.98 | 107.12 | 97.96 | 109.92 |
| April | 103.63 | 107.12 | 104.84 | 96.88 | 110.02 |
| May | 104.16 | 107.20 | 106.11 | 97.85 | 109.56 |
| June | 105.93 | 108.08 | 109.53 | 100.00 | 110.52 |
| July | 107.62 | 113.16 | 108.09 | 97.62 | 111.15 |
| August | 106.77 | 113.43 | 107.27 | 95.34 | 109.76 |
| September | 105.42 | 110.91 | 106.81 | 94.17 | 109.70 |
| October | 104.36 | 111.70 | 104.40 | 91.13 | 109.78 |
| November | 105.38 | 113.34 | 106.48 | 90.79 | 110.51 |
| December | 106.85 | 114.99 | 108.38 | 87.54 | 111.16 |
| 2016 | |||||
| January | 108.57 | 119.69 | 107.82 | 83.33 | 111.75 |
| February | 104.04 | 115.00 | 102.56 | 82.50 | 110.72 |
| March | 103.20 | 112.49 | 100.55 | 84.15 | 113.65 |
| April | 104.43 | 112.96 | 102.17 | 87.18 | 112.08 |
| May | 103.97 | 111.70 | 103.41 | 86.11 | 113.89 |
| June | 104.73 | 113.26 | 103.31 | 87.92 | 113.46 |
| July | 104.75 | 113.17 | 104.49 | 86.18 | 116.21 |
| August | 105.74 | 114.09 | 102.71 | 88.08 | 118.68 |
| Source: Statistics Canada, CANSIM table 304-0015. | |||||
More recently, manufacturing sales edged up 0.9% in August, following little change in July. Sales of food products, primary metals, and petroleum and coal products increased during the summer months.
Retail spending moderated into mid-year
Total retail sales were 1.7% higher in the first half of 2016, reflecting broad-based gains across store types. Higher sales among motor vehicle and parts dealers, general merchandise stores and health and personal care stores contributed to the increase. Lower sales at gasoline stations in the first half, down 7.3% on lower gas prices in the first quarter, weighed on retail spending. Excluding gasoline stations, retail sales in the first half were 2.7% higher than total spending in the last half of 2015. Ontario, Quebec and British Columbia posted the largest gains, while sales in Alberta declined.
After notable gains to start the year, retail sales moderated during the winter and spring. Lower sales of autos and gasoline contributed to slower retail spending in recent months. Retail sales edged lower in July and August as sales at gasoline stations and motor vehicle and parts dealers declined.
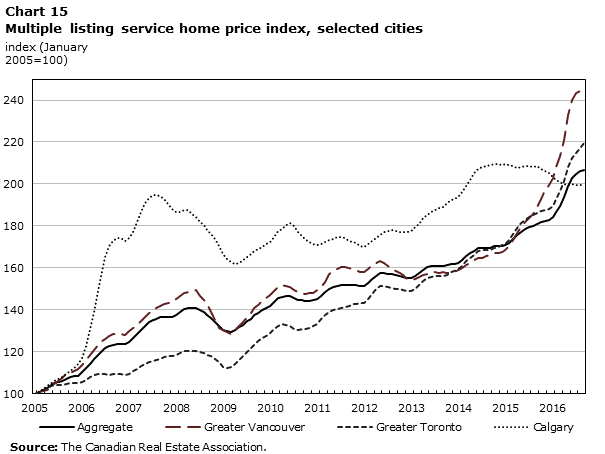
Home prices accelerated in Toronto and Vancouver
Home prices rose markedly during the first half of 2016 (Chart 15). According to estimates from the Aggregate Composite MLS Home Price Index, home prices were up 13.6% year-over-year in June, led by gains in Vancouver and Toronto.Note 10 In Greater Vancouver, prices were 32.1% higher in June 2016 than in June 2015. In the Greater Toronto area, home prices were up 16.0% year-over-year in June and continued to increase through the summer months, reaching 18.0% in September. By contrast, home prices in Calgary declined year-over-year in the first half of 2016, down 4.1% in June and remained stable in more recent months.
Data table for Chart 15
| Year | Aggregate | Greater Vancouver | Greater Toronto | Calgary |
|---|---|---|---|---|
| index (January 2005=100) | ||||
| 2005 | ||||
| January | 100.0 | 100.0 | 100.0 | 100.0 |
| February | 100.9 | 100.6 | 100.8 | 100.9 |
| March | 101.9 | 101.1 | 101.8 | 102.2 |
| April | 102.8 | 101.6 | 102.7 | 103.5 |
| May | 103.9 | 103.1 | 103.4 | 105.0 |
| June | 104.9 | 104.7 | 104.0 | 106.1 |
| July | 105.5 | 106.1 | 104.0 | 106.9 |
| August | 106.1 | 107.5 | 104.1 | 108.1 |
| September | 107.1 | 109.3 | 104.6 | 109.3 |
| October | 107.7 | 110.0 | 104.9 | 110.9 |
| November | 108.2 | 110.8 | 105.1 | 112.2 |
| December | 108.6 | 111.7 | 105.2 | 113.9 |
| 2006 | ||||
| January | 110.1 | 113.8 | 105.7 | 117.0 |
| February | 112.0 | 116.2 | 106.7 | 122.8 |
| March | 114.2 | 118.3 | 107.8 | 130.7 |
| April | 116.3 | 120.8 | 108.7 | 139.0 |
| May | 118.5 | 123.2 | 109.3 | 149.1 |
| June | 120.5 | 125.2 | 109.3 | 158.7 |
| July | 121.7 | 126.2 | 109.3 | 165.3 |
| August | 122.6 | 127.4 | 109.0 | 170.2 |
| September | 123.4 | 128.3 | 109.2 | 172.9 |
| October | 123.7 | 128.3 | 109.2 | 174.1 |
| November | 123.8 | 128.3 | 109.1 | 174.1 |
| December | 123.5 | 128.0 | 108.7 | 172.6 |
| 2007 | ||||
| January | 124.7 | 129.8 | 109.2 | 174.0 |
| February | 126.4 | 131.2 | 110.7 | 177.1 |
| March | 128.4 | 132.5 | 111.9 | 181.9 |
| April | 130.4 | 134.5 | 113.1 | 186.5 |
| May | 132.3 | 136.4 | 114.2 | 190.8 |
| June | 134.0 | 138.2 | 115.2 | 193.2 |
| July | 135.1 | 139.4 | 115.7 | 194.6 |
| August | 135.8 | 140.8 | 116.1 | 194.8 |
| September | 136.3 | 141.9 | 116.6 | 194.4 |
| October | 136.7 | 142.6 | 117.4 | 192.9 |
| November | 136.7 | 143.3 | 117.7 | 190.6 |
| December | 136.7 | 143.9 | 117.8 | 188.0 |
| 2008 | ||||
| January | 137.4 | 145.1 | 118.3 | 186.4 |
| February | 138.8 | 146.7 | 119.3 | 186.6 |
| March | 140.2 | 148.0 | 120.1 | 187.4 |
| April | 140.8 | 148.5 | 120.4 | 187.4 |
| May | 140.9 | 148.8 | 120.5 | 185.7 |
| June | 140.7 | 149.2 | 120.2 | 184.0 |
| July | 139.7 | 146.6 | 119.6 | 181.7 |
| August | 138.8 | 144.8 | 119.2 | 180.2 |
| September | 137.7 | 142.9 | 118.4 | 178.2 |
| October | 136.1 | 139.0 | 117.7 | 176.2 |
| November | 134.2 | 135.1 | 116.4 | 173.7 |
| December | 132.0 | 131.3 | 114.9 | 170.4 |
| 2009 | ||||
| January | 130.5 | 130.4 | 112.7 | 166.5 |
| February | 129.7 | 129.3 | 112.2 | 164.1 |
| March | 129.6 | 128.4 | 112.9 | 162.8 |
| April | 130.4 | 130.2 | 114.3 | 162.0 |
| May | 131.6 | 132.1 | 116.1 | 162.5 |
| June | 132.9 | 134.1 | 117.9 | 163.7 |
| July | 134.4 | 136.3 | 119.8 | 165.1 |
| August | 135.8 | 138.5 | 121.6 | 166.6 |
| September | 137.3 | 141.0 | 123.4 | 167.8 |
| October | 138.6 | 142.2 | 125.1 | 169.0 |
| November | 139.7 | 144.0 | 126.7 | 170.1 |
| December | 140.6 | 145.5 | 127.6 | 171.3 |
| 2010 | ||||
| January | 141.9 | 147.1 | 128.9 | 172.2 |
| February | 143.8 | 148.8 | 130.8 | 174.7 |
| March | 145.4 | 150.6 | 132.3 | 177.4 |
| April | 146.3 | 151.6 | 133.0 | 178.7 |
| May | 146.6 | 151.4 | 132.9 | 180.3 |
| June | 146.4 | 150.6 | 132.1 | 181.2 |
| July | 145.4 | 149.2 | 130.9 | 179.7 |
| August | 144.6 | 148.5 | 130.3 | 177.0 |
| September | 144.4 | 148.0 | 130.7 | 175.2 |
| October | 144.2 | 147.6 | 130.8 | 173.6 |
| November | 144.3 | 148.0 | 131.4 | 172.1 |
| December | 144.4 | 148.0 | 132.4 | 171.5 |
| 2011 | ||||
| January | 145.2 | 149.3 | 133.4 | 170.7 |
| February | 146.7 | 150.7 | 135.7 | 171.2 |
| March | 148.4 | 153.4 | 137.4 | 172.1 |
| April | 149.9 | 156.8 | 138.8 | 173.1 |
| May | 150.8 | 158.4 | 140.0 | 173.8 |
| June | 151.2 | 159.6 | 140.2 | 174.9 |
| July | 151.6 | 160.2 | 140.9 | 174.6 |
| August | 151.7 | 160.3 | 141.5 | 174.1 |
| September | 151.7 | 159.9 | 142.0 | 173.0 |
| October | 151.8 | 159.2 | 142.6 | 172.5 |
| November | 151.6 | 158.8 | 142.7 | 171.7 |
| December | 151.1 | 158.1 | 143.1 | 170.2 |
| 2012 | ||||
| January | 151.4 | 158.2 | 143.2 | 169.8 |
| February | 152.8 | 159.6 | 145.2 | 171.2 |
| March | 154.8 | 161.3 | 147.6 | 172.7 |
| April | 156.3 | 162.4 | 149.7 | 174.0 |
| May | 157.3 | 163.4 | 151.1 | 175.7 |
| June | 157.6 | 162.1 | 151.4 | 177.0 |
| July | 157.1 | 160.9 | 150.9 | 177.6 |
| August | 156.8 | 159.2 | 150.4 | 177.8 |
| September | 156.5 | 158.3 | 150.0 | 177.7 |
| October | 156.1 | 157.6 | 149.8 | 177.3 |
| November | 155.7 | 156.4 | 149.4 | 177.1 |
| December | 155.2 | 154.8 | 149.0 | 176.9 |
| 2013 | ||||
| January | 155.0 | 154.2 | 148.7 | 177.7 |
| February | 156.0 | 154.8 | 149.8 | 179.5 |
| March | 157.5 | 155.5 | 151.9 | 181.1 |
| April | 159.0 | 156.7 | 153.9 | 183.6 |
| May | 160.3 | 156.9 | 155.3 | 185.4 |
| June | 160.8 | 157.8 | 155.8 | 186.6 |
| July | 160.9 | 157.8 | 156.0 | 187.5 |
| August | 160.9 | 157.7 | 156.0 | 188.4 |
| September | 161.0 | 157.8 | 156.1 | 189.1 |
| October | 161.5 | 157.6 | 156.6 | 191.1 |
| November | 161.8 | 158.1 | 157.9 | 192.1 |
| December | 161.8 | 158.2 | 158.4 | 192.7 |
| 2014 | ||||
| January | 162.3 | 159.1 | 159.2 | 193.9 |
| February | 163.8 | 159.8 | 160.7 | 196.2 |
| March | 165.6 | 161.3 | 163.1 | 199.1 |
| April | 167.0 | 162.3 | 164.8 | 202.0 |
| May | 168.2 | 163.7 | 166.3 | 205.0 |
| June | 169.3 | 164.7 | 167.9 | 207.1 |
| July | 169.5 | 164.8 | 168.3 | 208.0 |
| August | 169.5 | 165.6 | 168.3 | 208.5 |
| September | 169.6 | 166.2 | 168.3 | 209.1 |
| October | 170.3 | 167.0 | 169.6 | 209.5 |
| November | 170.2 | 167.1 | 170.1 | 209.3 |
| December | 170.4 | 167.4 | 170.9 | 209.2 |
| 2015 | ||||
| January | 170.8 | 168.3 | 171.2 | 209.5 |
| February | 172.0 | 170.4 | 173.4 | 208.9 |
| March | 173.8 | 173.2 | 176.0 | 208.4 |
| April | 175.5 | 176.4 | 178.8 | 207.4 |
| May | 177.1 | 179.4 | 181.2 | 207.9 |
| June | 178.4 | 181.9 | 183.0 | 208.5 |
| July | 179.3 | 183.7 | 184.1 | 208.4 |
| August | 179.8 | 185.8 | 185.1 | 208.2 |
| September | 180.7 | 189.2 | 185.9 | 208.4 |
| October | 181.6 | 192.8 | 187.0 | 207.3 |
| November | 182.4 | 197.2 | 187.7 | 206.1 |
| December | 182.9 | 199.4 | 188.1 | 205.0 |
| 2016 | ||||
| January | 184.0 | 202.9 | 189.5 | 203.1 |
| February | 186.6 | 208.2 | 193.0 | 201.7 |
| March | 189.6 | 213.3 | 196.4 | 200.7 |
| April | 193.6 | 221.1 | 201.4 | 200.2 |
| May | 199.2 | 232.7 | 208.3 | 199.7 |
| June | 202.7 | 240.2 | 212.2 | 200.0 |
| July | 204.9 | 243.5 | 214.9 | 199.7 |
| August | 206.2 | 244.2 | 217.0 | 199.7 |
| September | 206.8 | 242.5 | 219.4 | 199.8 |
|
Source: The Canadian Real Estate Association. |
||||
Monthly housing starts averaged 198,100 units (seasonally adjusted at annual rates) in the first half of 2016, down from 203,400 in the second half of 2015. Lower multi-family starts were responsible for the slower pace in the first half of 2016, as declines in Alberta and in Toronto were partly offset by gains in Vancouver. Total starts edged lower in July and August, as multi-family starts slowed further.
Investment in new housing construction, measured year-over-year, strengthened during the first half of 2016. Capital spending on single units rose from February to June 2016, following eight consecutive declines. Spending on double units has declined year-over-year since May 2015. Outlays on apartments moderated to 16.7% year-over-year in June. Monthly residential building permits averaged $4.2 billion in the first half of 2016, down from $4.5 billion in the second half of 2015.
Headline inflation slowed as food prices moderated
Consumer price inflation, measured year-over-year, averaged 1.5% during the first half of 2016 and 1.2% from July to September. Excluding food and energy, consumer inflation averaged 1.9% during this 9 month period.
Food prices contributed to lower inflation during the first half of the year and into the summer. The increase in the food index, measured year-over-year, slowed from 4.0% in January to 3.2% in April, before decelerating further to less than 2% from May to August. Price increases for fresh fruit and vegetables, up 15.7% year-over-year in January 2016, slowed to 4.8% in June, and continued to moderate in July and August. In September, food prices posted their smallest year-over-year increase (+0.1%) since February 2000.
During the first half of 2016, consumers continued to pay less for energy products, including gasoline, on a year-over-year basis. On average, energy prices declined 4.4% year-over-year during the first half of 2016, compared to an average decline of 7.6% in the second half of 2015. More recently, energy prices were down 7.4% in the twelve months to July.
Prices for durable goods increased year-over-year during the first half of 2016 and into the third quarter, up 3.6% in the twelve months to August. Prices for passenger vehicles accelerated during this period, and were up 5.2% year-over-year in August.
Equities rose toward mid-year on broad-based gains
After losses in early 2016, Toronto stock prices (S&P/TSX composite index) rose into mid-year. Equities at June month end close were down 10% from their all-time high in August 2014 (Chart 16). Gains during the first half were broad-based, with energy, diversified metals and mining, gold, and materials posting notable gains. Financials edged up 2% during the first half of the year. As of June close, the Canadian energy index was down 42% from its level in August 2014.
Data table for Chart 16
| Year | S&P/TSX composite index | Canadian energy index | Canadian financial index |
|---|---|---|---|
| index (January 2007=100) | |||
| 2007 | |||
| January | 100.0 | 100.0 | 100.0 |
| February | 100.1 | 98.1 | 100.4 |
| March | 101.0 | 101.2 | 102.2 |
| April | 102.9 | 103.7 | 102.4 |
| May | 107.8 | 111.1 | 104.3 |
| June | 106.7 | 110.7 | 101.7 |
| July | 106.4 | 109.8 | 98.5 |
| August | 104.8 | 104.0 | 100.6 |
| September | 108.2 | 107.4 | 102.5 |
| October | 112.2 | 111.6 | 104.5 |
| November | 105.0 | 101.5 | 101.4 |
| December | 106.1 | 108.7 | 96.2 |
| 2008 | |||
| January | 100.9 | 101.1 | 92.1 |
| February | 104.2 | 111.0 | 89.1 |
| March | 102.4 | 110.9 | 87.5 |
| April | 106.9 | 122.4 | 90.6 |
| May | 112.9 | 135.5 | 91.4 |
| June | 111.0 | 137.7 | 82.9 |
| July | 104.3 | 118.1 | 85.4 |
| August | 105.7 | 124.6 | 86.2 |
| September | 90.2 | 97.9 | 85.3 |
| October | 74.9 | 78.5 | 71.8 |
| November | 71.1 | 75.6 | 65.9 |
| December | 69.0 | 67.2 | 59.4 |
| 2009 | |||
| January | 66.7 | 63.7 | 54.9 |
| February | 62.3 | 61.0 | 48.8 |
| March | 66.9 | 67.2 | 54.9 |
| April | 71.5 | 72.9 | 63.5 |
| May | 79.6 | 85.0 | 69.5 |
| June | 79.6 | 82.2 | 73.5 |
| July | 82.8 | 81.7 | 81.4 |
| August | 83.4 | 81.1 | 81.9 |
| September | 87.4 | 89.7 | 84.0 |
| October | 83.7 | 87.9 | 77.5 |
| November | 87.8 | 88.7 | 80.7 |
| December | 90.1 | 92.3 | 82.2 |
| 2010 | |||
| January | 85.1 | 86.4 | 78.0 |
| February | 89.2 | 87.9 | 82.3 |
| March | 92.4 | 89.7 | 88.1 |
| April | 93.7 | 93.1 | 87.7 |
| May | 90.2 | 88.8 | 82.8 |
| June | 86.7 | 84.4 | 78.1 |
| July | 89.9 | 87.6 | 82.7 |
| August | 91.4 | 84.5 | 79.0 |
| September | 94.9 | 88.4 | 82.6 |
| October | 97.3 | 89.4 | 83.8 |
| November | 99.4 | 92.6 | 84.3 |
| December | 103.1 | 100.3 | 85.9 |
| 2011 | |||
| January | 104.0 | 105.6 | 86.4 |
| February | 108.5 | 112.6 | 91.8 |
| March | 108.3 | 110.8 | 93.2 |
| April | 107.0 | 107.9 | 91.6 |
| May | 105.9 | 104.3 | 91.4 |
| June | 102.0 | 98.1 | 89.4 |
| July | 99.3 | 96.4 | 84.0 |
| August | 98.0 | 88.4 | 83.0 |
| September | 89.2 | 75.0 | 79.5 |
| October | 94.0 | 84.9 | 80.9 |
| November | 93.6 | 85.0 | 77.5 |
| December | 91.7 | 83.4 | 79.4 |
| 2012 | |||
| January | 95.5 | 87.5 | 81.3 |
| February | 97.0 | 89.5 | 84.2 |
| March | 95.1 | 81.9 | 87.5 |
| April | 94.3 | 82.0 | 86.8 |
| May | 88.3 | 73.1 | 80.4 |
| June | 89.0 | 73.1 | 81.0 |
| July | 89.5 | 76.6 | 80.5 |
| August | 91.7 | 78.4 | 82.6 |
| September | 94.5 | 80.6 | 84.4 |
| October | 95.3 | 80.4 | 85.4 |
| November | 93.9 | 77.4 | 87.6 |
| December | 95.4 | 77.2 | 89.2 |
| 2013 | |||
| January | 97.3 | 79.0 | 92.0 |
| February | 98.4 | 78.9 | 94.6 |
| March | 97.8 | 78.6 | 92.3 |
| April | 95.6 | 76.4 | 91.7 |
| May | 97.1 | 78.4 | 93.3 |
| June | 93.1 | 75.6 | 92.2 |
| July | 95.8 | 78.9 | 96.0 |
| August | 97.1 | 80.2 | 97.4 |
| September | 98.1 | 81.9 | 99.1 |
| October | 102.5 | 84.0 | 105.2 |
| November | 102.8 | 83.1 | 107.8 |
| December | 104.5 | 84.7 | 108.9 |
| 2014 | |||
| January | 105.1 | 83.9 | 104.3 |
| February | 109.0 | 87.6 | 108.6 |
| March | 110.0 | 92.1 | 110.4 |
| April | 112.4 | 98.3 | 111.7 |
| May | 112.0 | 97.3 | 112.7 |
| June | 116.2 | 103.6 | 115.7 |
| July | 117.6 | 98.6 | 120.7 |
| August | 119.9 | 101.0 | 120.8 |
| September | 114.8 | 90.8 | 118.0 |
| October | 112.1 | 80.9 | 117.9 |
| November | 113.1 | 71.5 | 122.5 |
| December | 112.3 | 68.6 | 118.3 |
| 2015 | |||
| January | 112.6 | 67.1 | 108.4 |
| February | 116.9 | 68.9 | 116.6 |
| March | 114.3 | 67.5 | 114.7 |
| April | 116.8 | 73.5 | 118.3 |
| May | 115.2 | 68.3 | 116.3 |
| June | 111.7 | 63.8 | 114.5 |
| July | 111.0 | 58.1 | 114.1 |
| August | 106.3 | 56.8 | 110.4 |
| September | 102.1 | 51.7 | 109.7 |
| October | 103.8 | 55.6 | 113.2 |
| November | 103.3 | 55.0 | 114.4 |
| December | 99.8 | 50.3 | 110.3 |
| 2016 | |||
| January | 98.4 | 49.3 | 108.5 |
| February | 98.7 | 47.7 | 105.3 |
| March | 103.5 | 53.0 | 113.0 |
| April | 107.0 | 58.1 | 115.6 |
| May | 107.9 | 59.0 | 116.6 |
| June | 107.9 | 58.8 | 112.8 |
| July | 111.9 | 58.5 | 116.0 |
| August | 112.0 | 60.8 | 118.6 |
| September | 111.9 | 62.0 | 119.1 |
|
Source: Statistics Canada, CANSIM table 176-0047. |
|||
After advancing 3.7% in July, the S&P/TSX composite index was little changed in August and September. The consumer discretionary and financial indexes posted gains during the third quarter, while the energy index rose in August and September as crude prices strengthened.
The Canadian dollar strengthened against the U.S. dollar during the spring. The dollar rebounded to 78.0 cents U.S. in April from 70.3 cents in January (Chart 17). The exchange rate was less volatile during late spring and summer. The dollar edged down to 76.3 cents U.S. in September and then to 75.5 cents in October. Overall, the Canadian dollar has depreciated 19% relative to the U.S. dollar since July 2014. On a trade-weighted basis, the Canadian dollar was down 3% relative to other major currencies over this period.
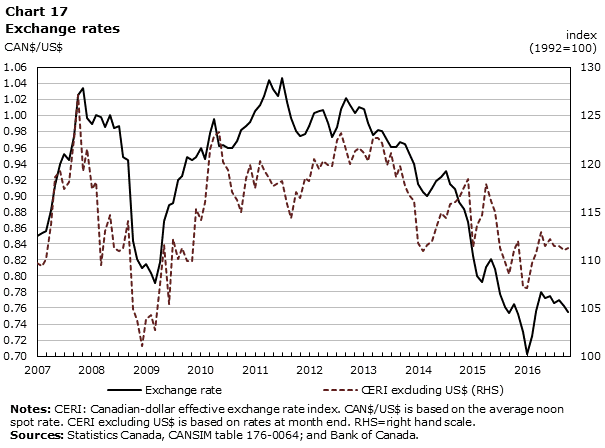
Data table for Chart 17
| Year | Exchange rate | CERI excluding US$ (RHS) |
|---|---|---|
| CAN$/US$ | index (1992=100) |
|
| 2007 | ||
| January | 0.850 | 109.68 |
| February | 0.854 | 109.32 |
| March | 0.856 | 110.11 |
| April | 0.882 | 113.74 |
| May | 0.913 | 118.59 |
| June | 0.939 | 119.26 |
| July | 0.952 | 117.35 |
| August | 0.945 | 118.12 |
| September | 0.975 | 122.63 |
| October | 1.025 | 127.11 |
| November | 1.034 | 119.20 |
| December | 0.997 | 121.49 |
| 2008 | ||
| January | 0.989 | 117.37 |
| February | 1.001 | 118.06 |
| March | 0.998 | 109.43 |
| April | 0.986 | 112.99 |
| May | 1.001 | 114.64 |
| June | 0.984 | 111.23 |
| July | 0.987 | 110.94 |
| August | 0.948 | 111.27 |
| September | 0.945 | 114.01 |
| October | 0.844 | 104.92 |
| November | 0.821 | 103.79 |
| December | 0.810 | 101.03 |
| 2009 | ||
| January | 0.815 | 103.86 |
| February | 0.803 | 104.25 |
| March | 0.791 | 102.69 |
| April | 0.817 | 107.46 |
| May | 0.869 | 111.51 |
| June | 0.888 | 105.43 |
| July | 0.891 | 112.14 |
| August | 0.919 | 110.11 |
| September | 0.924 | 111.28 |
| October | 0.948 | 109.93 |
| November | 0.944 | 109.85 |
| December | 0.948 | 115.30 |
| 2010 | ||
| January | 0.959 | 114.11 |
| February | 0.946 | 116.02 |
| March | 0.978 | 121.50 |
| April | 0.995 | 122.82 |
| May | 0.962 | 123.32 |
| June | 0.963 | 120.15 |
| July | 0.959 | 119.34 |
| August | 0.960 | 117.02 |
| September | 0.968 | 116.27 |
| October | 0.982 | 114.95 |
| November | 0.987 | 118.47 |
| December | 0.992 | 119.83 |
| 2011 | ||
| January | 1.006 | 117.49 |
| February | 1.013 | 120.31 |
| March | 1.024 | 119.38 |
| April | 1.044 | 118.53 |
| May | 1.033 | 117.69 |
| June | 1.024 | 118.01 |
| July | 1.047 | 118.21 |
| August | 1.017 | 115.76 |
| September | 0.997 | 114.38 |
| October | 0.981 | 117.03 |
| November | 0.975 | 116.46 |
| December | 0.977 | 118.55 |
| 2012 | ||
| January | 0.987 | 118.19 |
| February | 1.003 | 120.43 |
| March | 1.006 | 119.44 |
| April | 1.007 | 120.30 |
| May | 0.990 | 119.87 |
| June | 0.973 | 119.74 |
| July | 0.986 | 122.48 |
| August | 1.008 | 123.16 |
| September | 1.022 | 121.44 |
| October | 1.013 | 119.96 |
| November | 1.003 | 121.26 |
| December | 1.011 | 121.58 |
| 2013 | ||
| January | 1.008 | 121.05 |
| February | 0.990 | 120.32 |
| March | 0.976 | 122.64 |
| April | 0.982 | 122.67 |
| May | 0.981 | 122.17 |
| June | 0.969 | 119.87 |
| July | 0.961 | 121.07 |
| August | 0.961 | 118.65 |
| September | 0.967 | 119.73 |
| October | 0.965 | 117.65 |
| November | 0.953 | 116.74 |
| December | 0.940 | 116.14 |
| 2014 | ||
| January | 0.914 | 111.70 |
| February | 0.905 | 110.95 |
| March | 0.900 | 111.53 |
| April | 0.910 | 111.96 |
| May | 0.918 | 113.35 |
| June | 0.923 | 114.85 |
| July | 0.931 | 114.33 |
| August | 0.915 | 115.76 |
| September | 0.908 | 115.98 |
| October | 0.892 | 116.38 |
| November | 0.883 | 117.53 |
| December | 0.867 | 118.41 |
| 2015 | ||
| January | 0.825 | 111.31 |
| February | 0.800 | 113.64 |
| March | 0.792 | 114.61 |
| April | 0.811 | 117.86 |
| May | 0.821 | 116.16 |
| June | 0.809 | 115.00 |
| July | 0.777 | 111.23 |
| August | 0.761 | 109.82 |
| September | 0.754 | 108.54 |
| October | 0.765 | 111.07 |
| November | 0.753 | 112.01 |
| December | 0.730 | 107.13 |
| 2016 | ||
| January | 0.703 | 107.06 |
| February | 0.725 | 109.67 |
| March | 0.756 | 110.76 |
| April | 0.780 | 112.85 |
| May | 0.773 | 111.48 |
| June | 0.775 | 112.20 |
| July | 0.766 | 111.47 |
| August | 0.770 | 111.41 |
| September | 0.763 | 111.05 |
| October | 0.755 | 111.26 |
|
Notes: CERI: Canadian-dollar effective exchange rate index. CAN$/US$ is based on the average noon spot rate. CERI excluding US$ is based on rates at month end. RHS=right hand scale. Sources: Statistics Canada, CANSIM table 176-0064; and Bank of Canada. |
||
Commodity prices advanced into mid year
After declines early in the year, commodity prices advanced from March to June on higher energy prices (Chart 18). In September, the commodity price index was up 13% from its level at year end. Excluding energy, the index was up 1.6% over this period as higher prices for metals and minerals, fish and forestry were offset by lower agricultural prices. Overall, the commodity price index as of September 2016 was down 46% from the recent peak in June 2014.
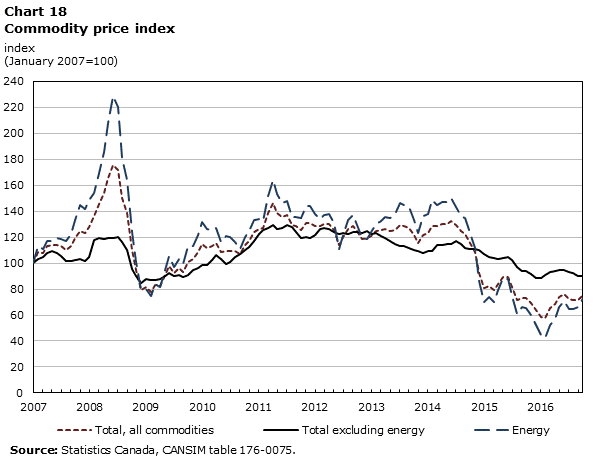
Data table for Chart 18
| Year | Total, all commodities | Total excluding energy | Energy |
|---|---|---|---|
| index (January 2007=100) | |||
| 2007 | |||
| January | 100.0 | 100.0 | 100.0 |
| February | 108.6 | 102.8 | 113.1 |
| March | 107.8 | 104.3 | 110.5 |
| April | 113.1 | 108.0 | 117.1 |
| May | 113.6 | 109.3 | 116.9 |
| June | 114.2 | 107.6 | 119.5 |
| July | 112.9 | 105.6 | 118.7 |
| August | 109.8 | 101.4 | 116.6 |
| September | 112.9 | 101.6 | 122.2 |
| October | 119.2 | 102.7 | 133.3 |
| November | 125.0 | 103.1 | 144.5 |
| December | 122.9 | 101.3 | 142.0 |
| 2008 | |||
| January | 127.6 | 105.0 | 148.3 |
| February | 136.4 | 117.6 | 154.2 |
| March | 145.4 | 119.3 | 169.2 |
| April | 153.7 | 118.7 | 185.6 |
| May | 165.2 | 119.3 | 207.6 |
| June | 175.6 | 119.6 | 228.4 |
| July | 171.7 | 119.8 | 220.4 |
| August | 150.2 | 116.4 | 180.9 |
| September | 138.3 | 110.4 | 163.7 |
| October | 110.2 | 95.7 | 124.2 |
| November | 94.9 | 90.3 | 101.1 |
| December | 79.3 | 84.4 | 79.1 |
| 2009 | |||
| January | 81.4 | 87.7 | 80.2 |
| February | 77.6 | 87.2 | 74.3 |
| March | 83.1 | 86.9 | 83.5 |
| April | 82.3 | 87.9 | 81.5 |
| May | 90.8 | 90.4 | 94.3 |
| June | 97.9 | 92.0 | 105.8 |
| July | 92.2 | 90.3 | 96.8 |
| August | 95.9 | 90.8 | 103.1 |
| September | 92.9 | 89.0 | 99.2 |
| October | 101.1 | 90.8 | 112.8 |
| November | 103.2 | 94.7 | 113.4 |
| December | 108.4 | 96.3 | 121.7 |
| 2010 | |||
| January | 114.3 | 98.2 | 131.5 |
| February | 111.8 | 98.7 | 126.1 |
| March | 113.2 | 102.3 | 125.6 |
| April | 115.6 | 106.1 | 126.9 |
| May | 108.3 | 103.0 | 116.0 |
| June | 109.3 | 99.1 | 121.0 |
| July | 109.6 | 100.9 | 120.0 |
| August | 109.3 | 104.8 | 116.4 |
| September | 107.3 | 107.3 | 111.1 |
| October | 113.6 | 109.8 | 120.2 |
| November | 117.3 | 112.3 | 125.0 |
| December | 123.8 | 117.3 | 132.8 |
| 2011 | |||
| January | 126.4 | 122.0 | 134.0 |
| February | 126.9 | 125.6 | 132.2 |
| March | 138.3 | 126.9 | 151.9 |
| April | 146.1 | 129.6 | 164.3 |
| May | 138.7 | 126.5 | 152.9 |
| June | 135.3 | 126.7 | 146.5 |
| July | 137.0 | 129.4 | 147.4 |
| August | 129.5 | 127.6 | 135.2 |
| September | 128.2 | 124.2 | 135.5 |
| October | 125.6 | 119.4 | 134.5 |
| November | 131.0 | 119.9 | 144.2 |
| December | 130.6 | 119.3 | 143.9 |
| 2012 | |||
| January | 128.5 | 121.7 | 137.9 |
| February | 128.4 | 126.1 | 134.1 |
| March | 130.4 | 127.1 | 137.0 |
| April | 130.4 | 126.3 | 137.5 |
| May | 125.8 | 123.8 | 131.1 |
| June | 113.8 | 122.0 | 111.2 |
| July | 119.9 | 122.8 | 121.3 |
| August | 126.1 | 122.3 | 132.9 |
| September | 128.9 | 123.6 | 136.9 |
| October | 124.5 | 123.6 | 129.0 |
| November | 118.8 | 123.1 | 119.1 |
| December | 119.1 | 125.0 | 118.4 |
| 2013 | |||
| January | 121.1 | 122.4 | 123.6 |
| February | 124.8 | 123.1 | 129.7 |
| March | 125.5 | 121.2 | 132.3 |
| April | 126.1 | 119.0 | 135.1 |
| May | 125.0 | 117.0 | 134.7 |
| June | 125.6 | 114.7 | 137.6 |
| July | 129.3 | 112.9 | 146.3 |
| August | 128.9 | 113.4 | 145.0 |
| September | 127.0 | 111.3 | 143.3 |
| October | 121.4 | 110.3 | 133.5 |
| November | 115.3 | 109.4 | 123.0 |
| December | 121.6 | 107.4 | 136.4 |
| 2014 | |||
| January | 123.1 | 109.0 | 138.0 |
| February | 128.9 | 109.4 | 148.3 |
| March | 128.8 | 113.9 | 144.4 |
| April | 130.3 | 114.0 | 147.0 |
| May | 130.3 | 114.5 | 146.7 |
| June | 132.2 | 114.4 | 150.2 |
| July | 129.1 | 116.9 | 142.8 |
| August | 124.6 | 114.9 | 136.2 |
| September | 122.5 | 111.9 | 134.8 |
| October | 115.1 | 110.7 | 122.8 |
| November | 108.4 | 110.8 | 111.5 |
| December | 92.0 | 110.0 | 86.2 |
| 2015 | |||
| January | 80.6 | 107.1 | 69.7 |
| February | 82.4 | 105.0 | 74.2 |
| March | 79.5 | 103.8 | 69.9 |
| April | 84.1 | 102.9 | 78.9 |
| May | 89.6 | 104.2 | 88.3 |
| June | 89.5 | 104.3 | 88.1 |
| July | 81.2 | 102.0 | 74.3 |
| August | 71.5 | 96.7 | 60.8 |
| September | 73.4 | 93.7 | 66.0 |
| October | 73.1 | 94.1 | 65.2 |
| November | 69.2 | 91.4 | 60.2 |
| December | 63.6 | 88.8 | 52.4 |
| 2016 | |||
| January | 58.6 | 88.4 | 44.5 |
| February | 57.8 | 90.5 | 42.1 |
| March | 65.3 | 93.2 | 52.4 |
| April | 68.3 | 93.8 | 57.2 |
| May | 73.5 | 94.6 | 65.9 |
| June | 76.0 | 94.5 | 70.6 |
| July | 72.5 | 93.3 | 65.0 |
| August | 71.9 | 92.7 | 64.3 |
| September | 71.7 | 90.2 | 65.8 |
| October | 75.2 | 89.7 | 72.9 |
|
Source: Statistics Canada, CANSIM table 176-0075. |
|||
Household leverage increased in the second quarter
Household credit market debt rose 2.0% in the second quarter to $1.97 trillion,Note 11 the largest quarterly increase, in percentage terms, since the second quarter of 2011. Household credit market debt to disposable income increased to a record 167.63% in the quarter, while the debt service ratio, which includes household payments on both interest and principal owing, edged up to 14.15% from 14.06% in the first quarter.
Household assets rose to $11.84 trillion in the second quarter, up from $11.61 trillion in the first. Household net worth —assets minus liabilities — rose 1.9% to $9.84 trillion in the second quarter supported by higher prices for real estate.
- Date modified: