
Population Trends by Age and Sex, 2016 Census of Population

Archived Content
Information identified as archived is provided for reference, research or recordkeeping purposes. It is not subject to the Government of Canada Web Standards and has not been altered or updated since it was archived. Please "contact us" to request a format other than those available.
Description: Population Trends by Age and Sex, 2016 Census of Population
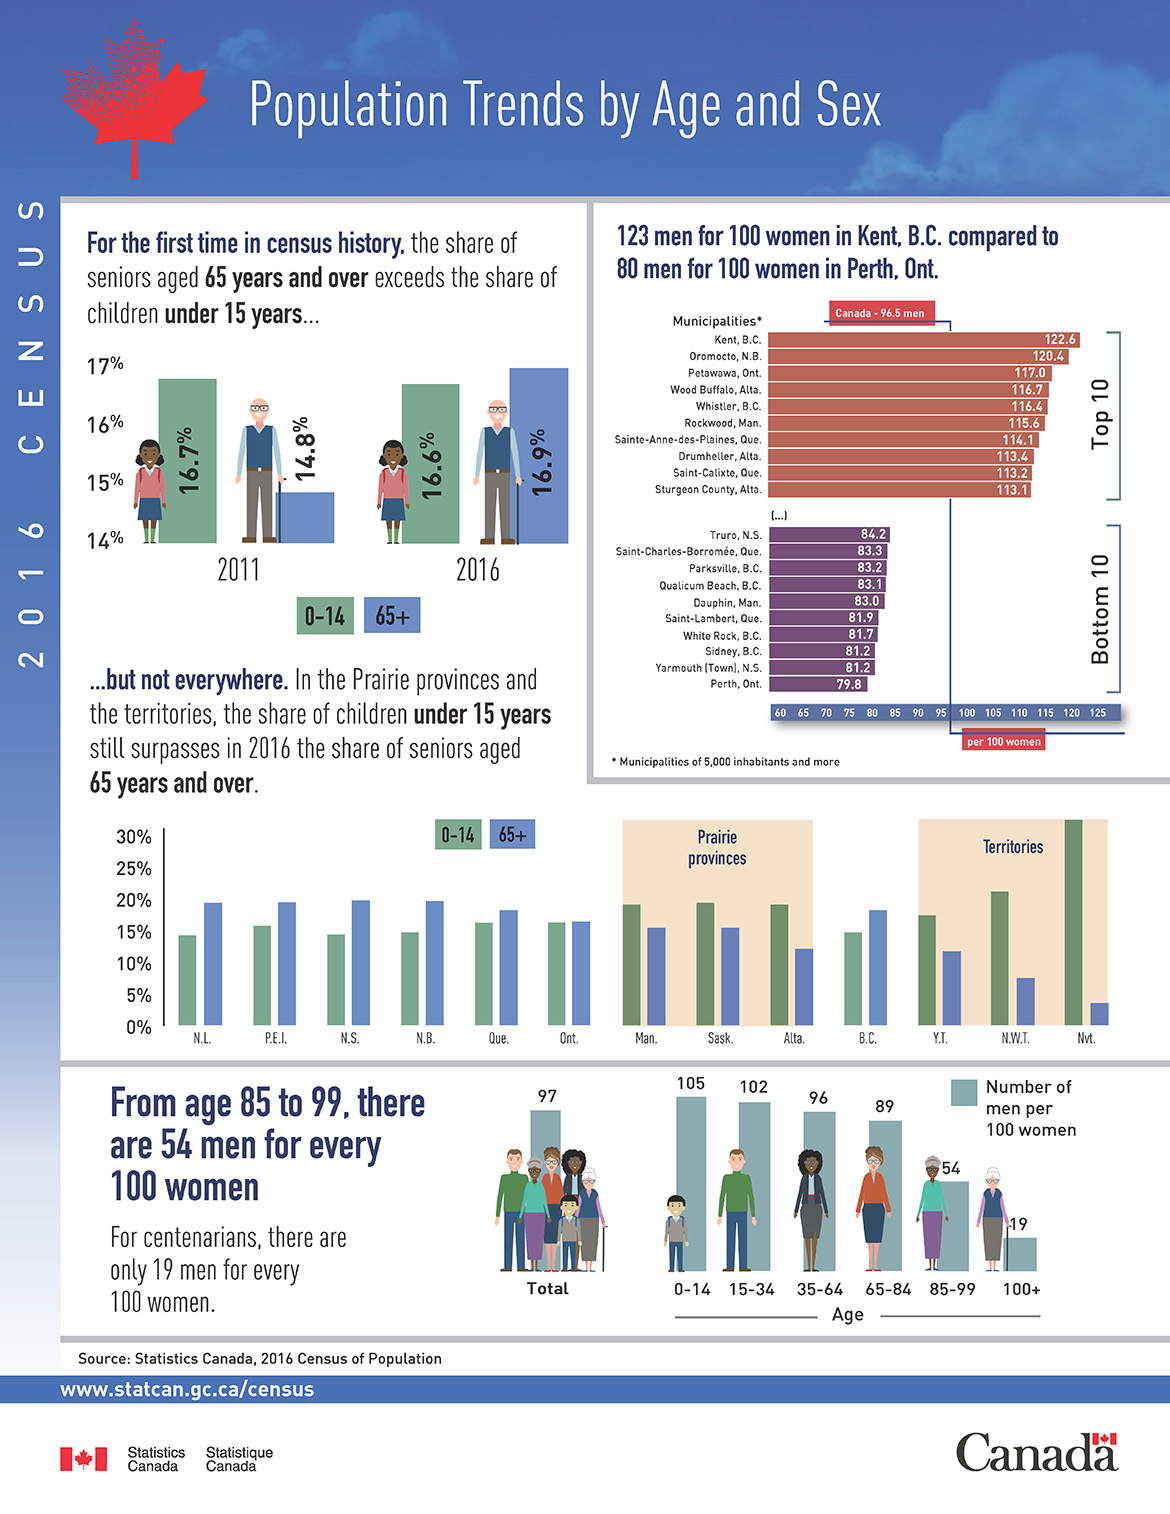
For the first time in census history, the share of seniors aged 65 years and over exceeds the share of children under 15 years, but not everywhere. In the Prairie provinces and the territories, the share of children under 15 years still surpasses in 2016 the share of seniors aged 65 years and over.
The following table shows both 65 years and over and 15 years and under between 2011 and 2016 in percentage.
| 2011 | 2016 | |
|---|---|---|
| Percentage 15 years and under | 16.7% | 16.6% |
| Percentage 65 years and older | 14.8% | 16.9% |
The following chart shows in percentage of those aged 65 years and older and those 15 years and under across the country.
| Province | 15 years and under (percentage) |
65 years and older (percentage) |
|---|---|---|
| N.L. | 16.6% | 16.9% |
| P.E.I | 14.3% | 19.4% |
| N.S. | 15.9% | 19.4% |
| N.B. | 14.5% | 19.9% |
| Que. | 16.3% | 18.3% |
| Ont. | 16.4% | 16.7% |
| Man. | 19.1% | 15.6% |
| Sask. | 19.6% | 15.5% |
| Alta. | 19.2% | 12.3% |
| B.C. | 14.9% | 18.3% |
| Y.T. | 17.5% | 11.9% |
| N.W.T | 21.2% | 7.7% |
| Nvt. | 32.5% | 3.8% |
- In Canada there are 96.5 men per 100 women.
- 123 men for 100 women in Kent, British Columbia, compared to 80 men for 100 women in Perth, Ontario.
The following charts show municipalities of 5,000 inhabitants and more.
| Municipalities | Rate of men |
|---|---|
| Kent. B.C. | 122.6 |
| Oromocto, N.B. | 120.4 |
| Petawawa, Ont. | 117.0 |
| Wood Buffalo, Alta. | 116.7 |
| Whistler, B.C. | 116.4 |
| Rockwood, Man. | 115.6 |
| Sainte-Anne-des-Plaines, Que. | 114.1 |
| Drumheller, Alta. | 113.4 |
| Saint-Calixte, Que. | 113.2 |
| Sturgeon Country, Alta. | 113.1 |
| Municipalities | Rate of men |
|---|---|
| Truro, N.S. | 84.2 |
| Saint-Charles-Borromée, Que. | 83.3 |
| Parksville, B.C. | 83.2 |
| Dauphin, Man. | 83.1 |
| Qualicum Beach, B.C. | 83.0 |
| Saint-Lambert, Que. | 81.9 |
| White Rock, B.C. | 81.7 |
| Sidney, B.C. | 81.2 |
| Yarmouth (Town), N.S. | 81.2 |
| Perth, Ont. | 79.8 |
- From age 85 to 99, there are 54 men for every 100 women.
- For centenarians, there are only 19 men for every 100 women.
Chart shows the total number of men per 100 women by age group.
| Age group | Number of men per 100 women |
|---|---|
| 0-14 | 105 |
| 15-34 | 102 |
| 35-64 | 96 |
| 65-84 | 89 |
| 85-99 | 54 |
| 100+ | 19 |
| Total for all groups | 97 |
Source: Statistics Canada, 2016 Census of Population
- Date modified: