
Police-reported crime in Canada, 2017

Archived Content
Information identified as archived is provided for reference, research or recordkeeping purposes. It is not subject to the Government of Canada Web Standards and has not been altered or updated since it was archived. Please "contact us" to request a format other than those available.
Description: Police-reported crime in Canada, 2017
Police-reported crime in Canada, 2017
Canada's crime rate:
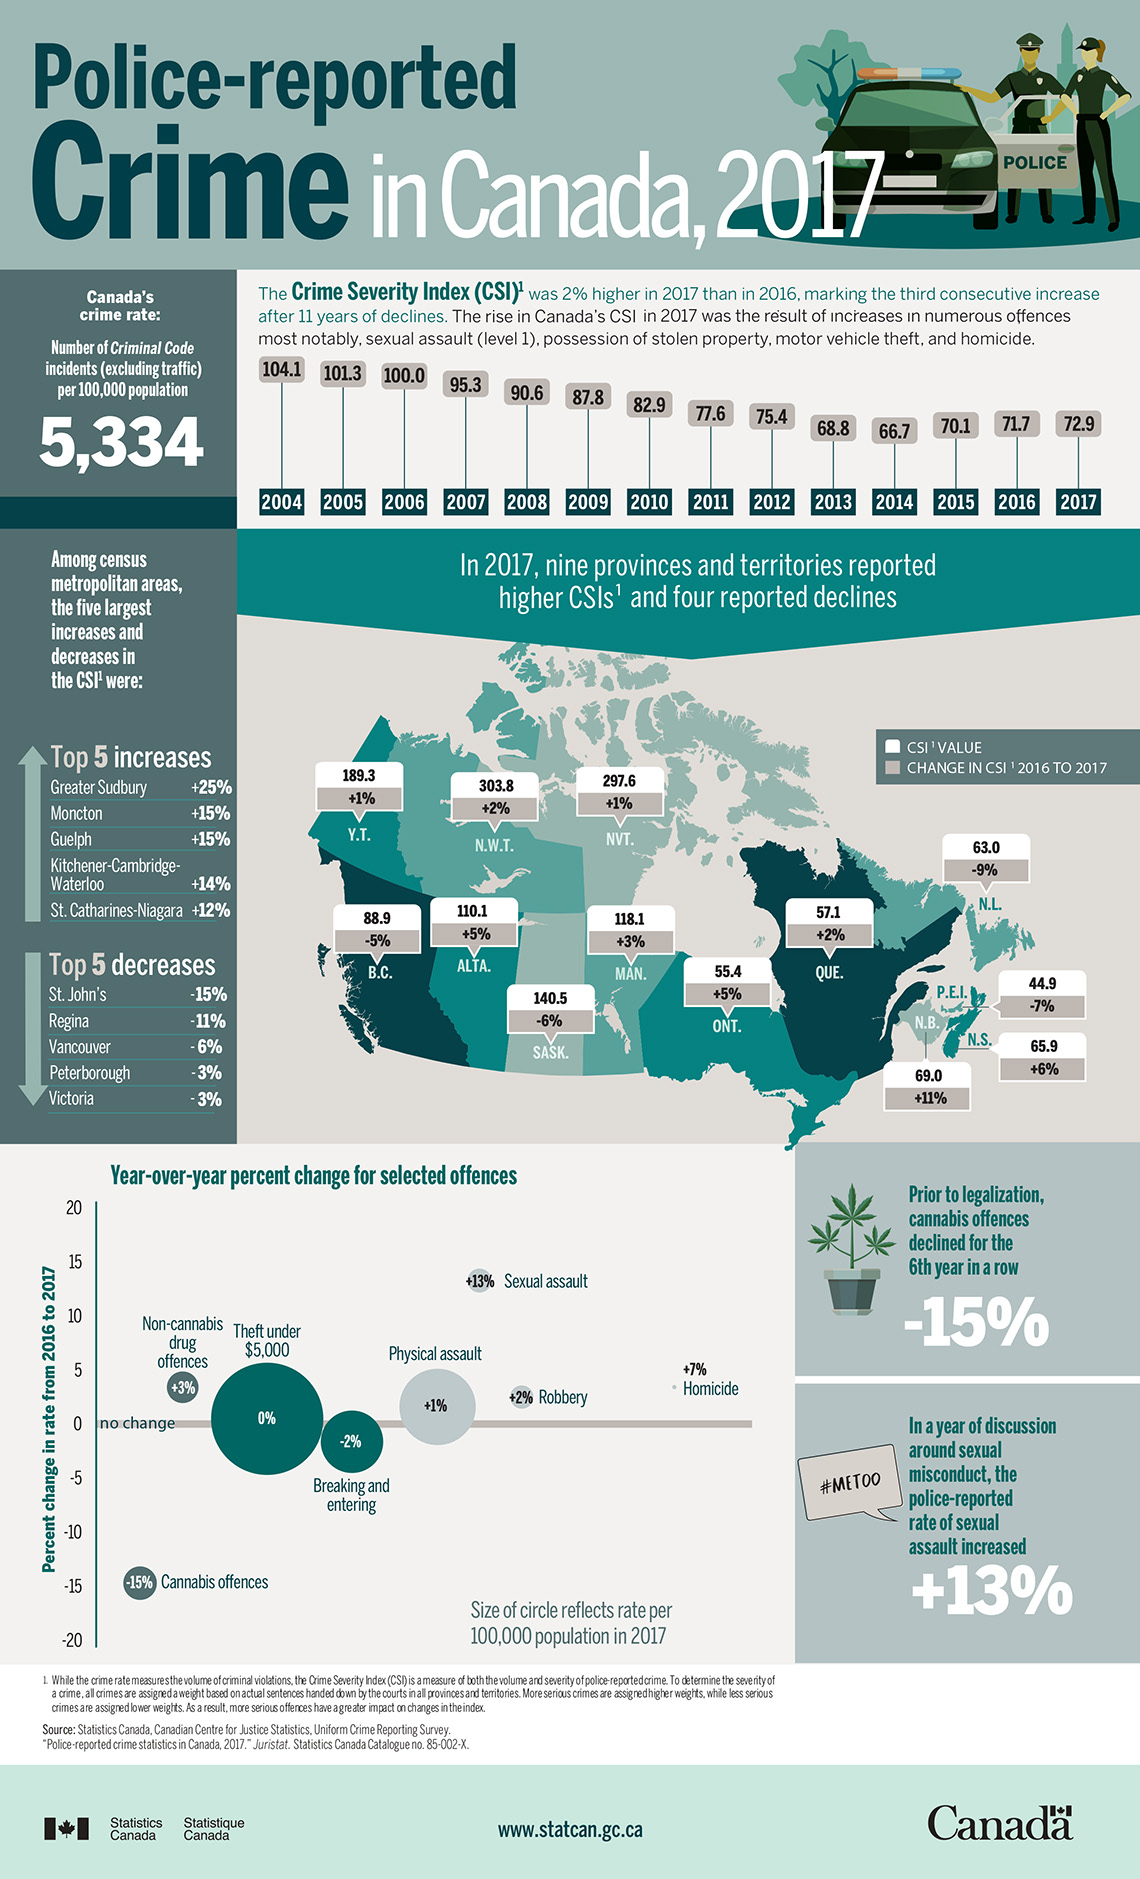
Number of Criminal Code incidents (excluding traffic) per 100,000 population — 5,334
The Crime Severity Index (CSI)Footnote 1 was 2% higher than in 2017, marking the third consecutive increase after 11 years of declines. The rise in Canada's CSI in 2017 was the result of increases in numerous offences, most notably, sexual assault (level 1), possession of stolen property, motor vehicle theft, and homicide.
| Year | CSI |
|---|---|
| 2004 | 104.1 |
| 2005 | 101.3 |
| 2006 | 100.0 |
| 2007 | 95.3 |
| 2008 | 90.6 |
| 2009 | 87.8 |
| 2010 | 82.9 |
| 2011 | 77.6 |
| 2012 | 75.4 |
| 2013 | 68.8 |
| 2014 | 66.7 |
| 2015 | 70.1 |
| 2016 | 71.7 |
| 2017 | 72.9 |
Among Census Metropolitan Areas (CMAs), the five largest increases and decreases in the CSI were as follows:
| CMA | Change in CSI, 2016 to 2017 |
|---|---|
| Greater Sudbury | +25% |
| Moncton | +15% |
| Guelph | +15% |
| Kitchener-Cambridge-Waterloo | +14% |
| St. Catharines-Niagara | +12% |
| CMA | Change in CSI, 2016 to 2017 |
|---|---|
| St. John's | -15% |
| Regina | -11% |
| Vancouver | -6% |
| Peterborough | -3% |
| Victoria | -3% |
| Province or territory | CSI value | Change in CSI, 2016 to 2017 |
|---|---|---|
| Newfoundland and Labrador | 63.0 | -9% |
| Prince Edward Island | 44.9 | -7% |
| Nova Scotia | 65.9 | +6% |
| New Brunswick | 69.0 | +11% |
| Quebec | 57.1 | +2% |
| Ontario | 55.4 | +5% |
| Manitoba | 118.1 | +3% |
| Saskatchewan | 140.5 | -6% |
| Alberta | 110.1 | +5% |
| British Columbia | 88.9 | -5% |
| Yukon | 189.3 | +1% |
| Northwest Territories | 303.8 | +2% |
| Nunavut | 297.6 | +1% |
| Type of offence | Rate | Percentage change in rate from 2016-2017 |
|---|---|---|
| Theft under $5,000 | 1,375 | 0% |
| Breaking and entering | 434 | -2% |
| Physical assault | 630 | +1% |
| Sexual assault | 67 | +13% |
| Robbery | 62 | +2% |
| Homicide | 2 | +7% |
| Cannabis offence | 131 | -15% |
| Non-cannabis drug offences | 116 | +3% |
-15% — Prior to legalization, cannabis offences declined for the 6th year in a row
+13% — In a year of discussion around sexual misconduct, the police-reported rate of sexual assault increased
Source: Statistics Canada Canadian Centre for Justice Statistics, Uniform Crime Reporting Survey. "Police-reported crime statistics in Canada, 2017." Juristat. Statistics Canada Catalogue no. 85-002-X.
- Date modified: