
Infographic: Homicide in Canada, 2017

Archived Content
Information identified as archived is provided for reference, research or recordkeeping purposes. It is not subject to the Government of Canada Web Standards and has not been altered or updated since it was archived. Please "contact us" to request a format other than those available.
Homicide in Canada, 2017
Homicide in Canada, 2017
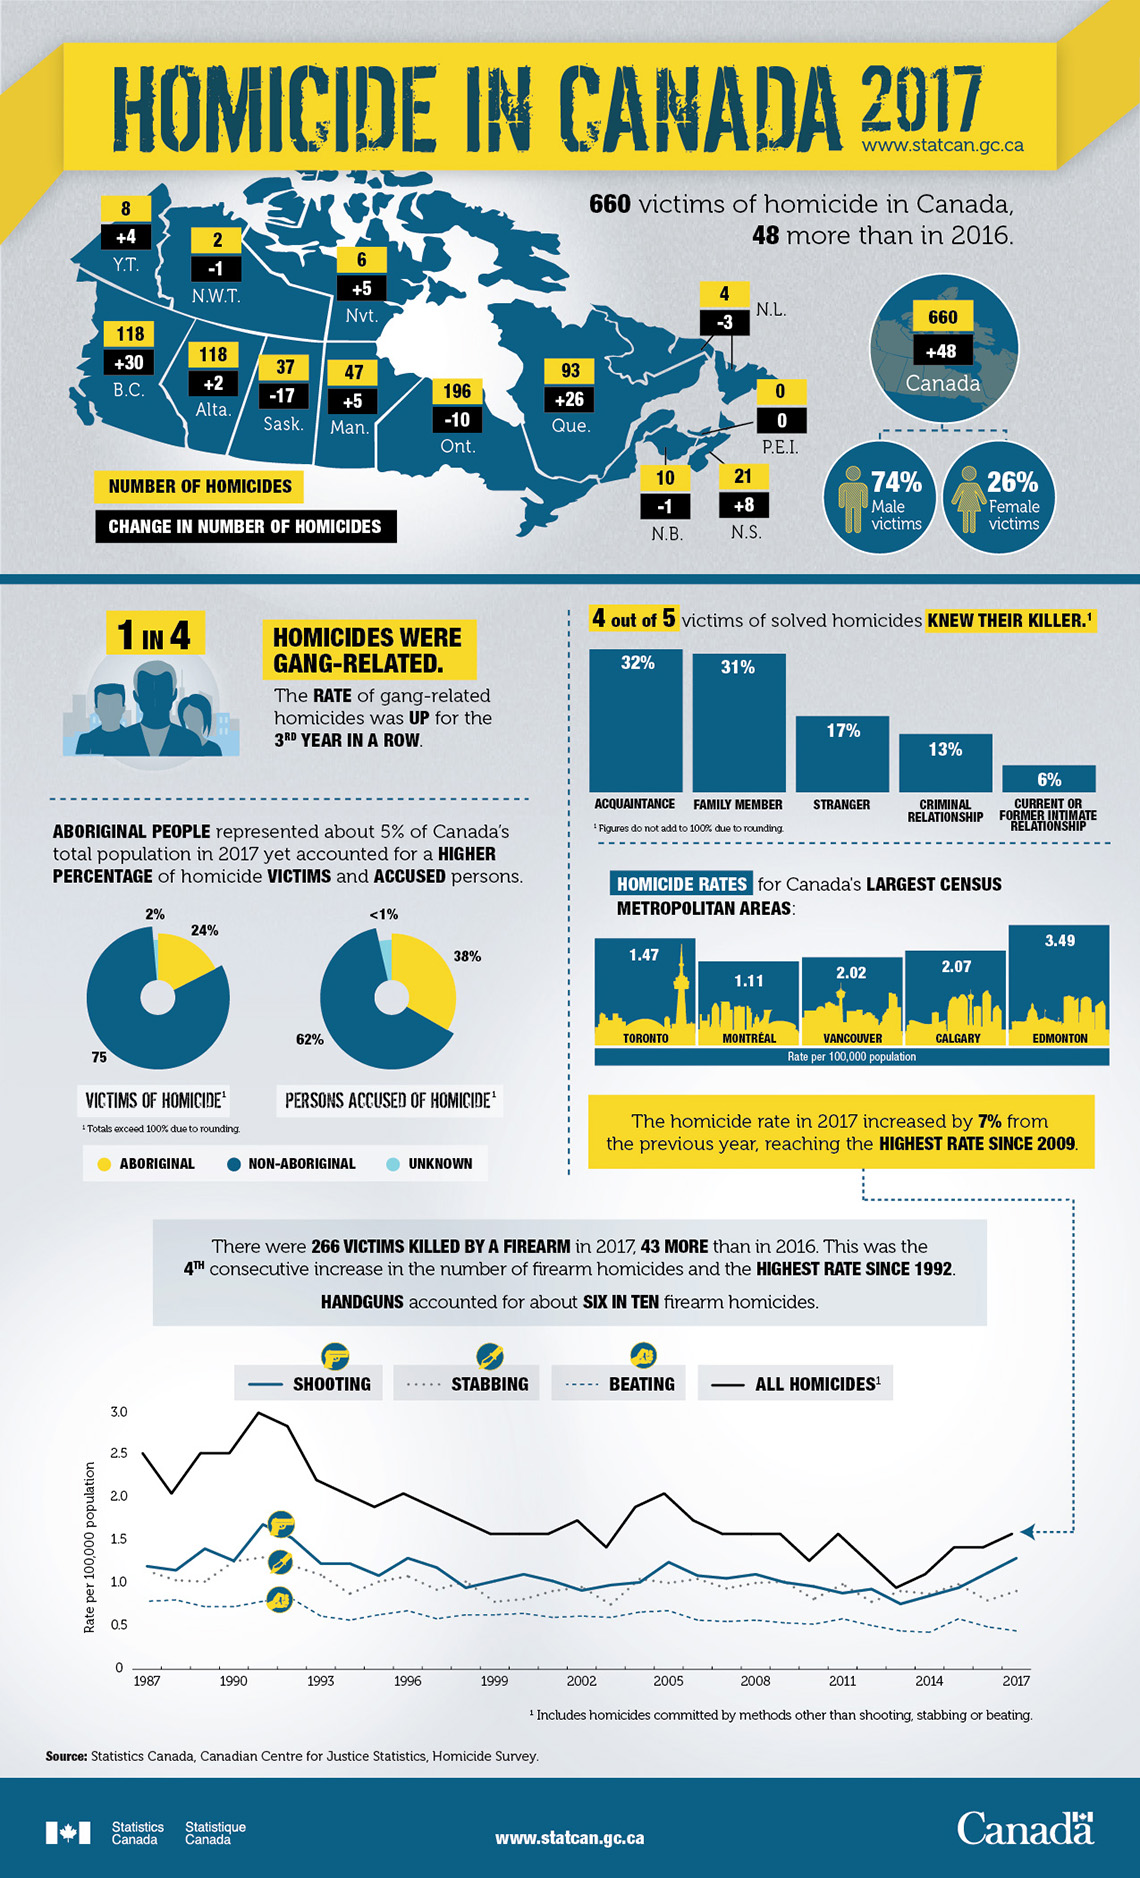
660 victims of homicide in Canada, 48 more than in 2016.
- Male victims: 74%
- Female victims: 26%
| Province or territory | Number of homicides | Change in number of homicides |
|---|---|---|
| Canada | 660 | +48 |
| Newfoundland and Labrador | 4 | -3 |
| Prince Edward Island | 0 | 0 |
| Nova Scotia | 21 | +8 |
| New Brunswick | 10 | -1 |
| Quebec | 93 | +26 |
| Ontario | 196 | -10 |
| Manitoba | 47 | +5 |
| Saskatchewan | 37 | -17 |
| Alberta | 118 | +2 |
| British Columbia | 118 | +30 |
| Yukon | 8 | +4 |
| Northwest Territories | 2 | -1 |
| Nunavut | 6 | +5 |
1 in 4 homicides were gang-related. The rate of gang-related homicides was up for the 3rd year in a row.
Aboriginal people represented about 5% of Canada's total population in 2017 yet accounted for a higher percentage of homicide victims and accused persons.
ii. Victims of homicideFootnote 1:
- Aboriginal – 24%
- Non-Aboriginal – 75%
- Unknown – 2%
iii. Persons accused of homicideFootnote 1:
- Aboriginal – 38%
- Non-Aboriginal – 62%
- Unknown – 1%
4 out of 5 victims of solved homicides knew their killer.Footnote 2
- Acquaintance: 32%
- Family member: 31%
- Stranger: 17%
- Criminal relationship: 13%
- Current or former intimate relationship: 6%
| CMA | Rate per 100,000 population |
|---|---|
| Toronto | 1.47 |
| Montréal | 1.11 |
| Vancouver | 2.02 |
| Calgary | 2.07 |
| Edmonton | 3.49 |
The homicide rate in 2017 increased by 7% from the previous year, reaching the highest rate since 2009.
There were 266 victims killed by a firearm in 2017, 43 more than in 2016. This was the fourth consecutive increase in the number of firearm homicides and the highest rate since 1992.
Handguns accounted for about six in ten firearm homicides.
| Year | Shooting | Stabbing | Beating | All homicidesFootnote 3 |
|---|---|---|---|---|
| 1987 | 0.76 | 0.70 | 0.51 | 2.4 |
| 1988 | 0.63 | 0.63 | 0.52 | 2.1 |
| 1989 | 0.79 | 0.62 | 0.47 | 2.4 |
| 1990 | 0.70 | 0.77 | 0.47 | 2.4 |
| 1991 | 0.97 | 0.80 | 0.51 | 2.7 |
| 1992 | 0.87 | 0.74 | 0.53 | 2.6 |
| 1993 | 0.68 | 0.67 | 0.40 | 2.2 |
| 1994 | 0.68 | 0.53 | 0.37 | 2.1 |
| 1995 | 0.59 | 0.62 | 0.41 | 2.0 |
| 1996 | 0.72 | 0.66 | 0.44 | 2.1 |
| 1997 | 0.65 | 0.56 | 0.38 | 2.0 |
| 1998 | 0.50 | 0.62 | 0.41 | 1.9 |
| 1999 | 0.55 | 0.47 | 0.41 | 1.8 |
| 2000 | 0.60 | 0.49 | 0.42 | 1.8 |
| 2001 | 0.55 | 0.55 | 0.39 | 1.8 |
| 2002 | 0.48 | 0.58 | 0.40 | 1.9 |
| 2003 | 0.52 | 0.45 | 0.39 | 1.7 |
| 2004 | 0.54 | 0.64 | 0.43 | 2.0 |
| 2005 | 0.69 | 0.61 | 0.44 | 2.1 |
| 2006 | 0.59 | 0.64 | 0.37 | 1.9 |
| 2007 | 0.57 | 0.57 | 0.36 | 1.8 |
| 2008 | 0.60 | 0.61 | 0.37 | 1.8 |
| 2009 | 0.54 | 0.62 | 0.35 | 1.8 |
| 2010 | 0.51 | 0.49 | 0.34 | 1.6 |
| 2011 | 0.46 | 0.60 | 0.38 | 1.8 |
| 2012 | 0.49 | 0.47 | 0.33 | 1.6 |
| 2013 | 0.38 | 0.55 | 0.29 | 1.4 |
| 2014 | 0.44 | 0.53 | 0.28 | 1.5 |
| 2015 | 0.50 | 0.60 | 0.38 | 1.7 |
| 2016 | 0.61 | 0.48 | 0.32 | 1.7 |
| 2017 | 0.72 | 0.55 | 0.29 | 1.8 |
Source: Statistics Canada, Canadian Centre for Justice Statistics, Homicide Survey
- Date modified: