
The Business & Community Newsletter – December 2015

Archived Content
Information identified as archived is provided for reference, research or recordkeeping purposes. It is not subject to the Government of Canada Web Standards and has not been altered or updated since it was archived. Please "contact us" to request a format other than those available.
Feature articles
In the December edition of the newsletter, we are putting ethnic diversity and immigration in the spotlight.
A snapshot of Canadian diversity
Whenever we walk down the street, read the local paper or watch the local or national news, we see that the face of the Canadian population is changing.
Immigration is a major driver of Canada's population growth. Over the last century, millions of men, women, and children have travelled from abroad to work, study, and live in Canada. Those who are granted the right to live in Canada permanently comprise Canada's immigrant population.
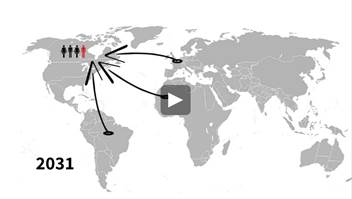
In 2011, 19% of Canada's population (or close to 1 in 5 people) reported belonging to a visible minority, up 5% from 1981. In 2031, this percentage could increase to 31%, or nearly 1 in 3 people, assuming that the source countries of immigration—often Asian countries—remain the same as today's.
Canadian Identity, 2013
 As Canada approaches its 150th anniversary, questions on what defines the Canadian identity are important points of reflection. Over the years, Canada's national identity has continuously changed, being shaped by shifts in the socio-demographic landscape of Canada, historical events and social relationships. It cannot be considered a stagnant construct, but rather one that evolves over time. And while identity, in itself, can be an interesting declaration of who Canadians are and what they stand for, the notion of how Canadians view themselves and others in Canadian society can have implications on their social integration, civic engagement and participation, and connections with others.
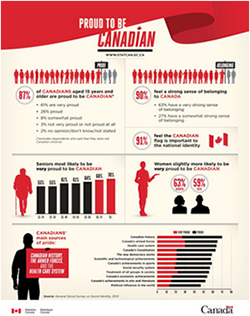
This report puts the spotlight on Canadians and provides a broad snapshot of the Canadian identity based on information the General Social Survey collected looking at variations by region and socio-demographic and economic characteristics. Three elements of national identity are discussed: national symbols, shared values and pride.
In 2013, Canadians were most likely to believe that the Charter of Rights and Freedoms (93%) and the national flag (91%) were important to the national identity. Next highest were the national anthem (88%), the RCMP (87%), and hockey (77%).
The majority of people believed that Canadians shared specific values. This was most often the case when thinking about the value of human rights (92%), and less often in relation to respect for Aboriginal culture (68%) and linguistic duality (73%).
For a bigger image please see "Infographic: General Social Survey on Social Identity, 2013".
More ethnic diversity and immigration data at your finger tips
 Whether you are a business manager, a policy maker or a community worker, it goes without saying just how important it is to understand this growing segment of the Canadian population. For example, where did they come from? How comfortable are they with conversing in English or French? And what are their socio-economic characteristics such as education and income? Statistics Canada conducts a number of surveys that shed light on the latest members of the Canadian society.
Labour Force Survey (LFS)
Conducted monthly, the Labour Force Survey (LFS) measures the current state of the Canadian labour market and is used, among other things, to calculate the national, provincial, territorial and regional employment and unemployment rates. Since January 2006, questions have been added to the survey questionnaire to identify immigrants and determine when they landed in Canada. This means that employment and unemployment data for immigrants and recent immigrants (defined as those who landed in Canada five years earlier or less) are available.
To access the data, simply go to CANSIM, Statistics Canada's key socioeconomic database. In the search box, enter key words such as "LFS immigrant" and submit the search request. Table 282-0101, for example, provides the employment and unemployment rates for immigrants who landed in Canada five years earlier or less.
Longitudinal Immigration Database (IMDB)
The Longitudinal Immigration Database (IMDB), which is a database combining immigration and taxation records, is a comprehensive source of data on the economic behaviour of the immigrant taxfiler population in Canada and is the only source of data that provides a direct link between immigration policy levers and the economic performance of immigrants. It allows the analysis of the economic outcomes of immigrants who came to Canada under different admission categories. The data are also available in CANSIM. In the search box, enter key words such as "income immigrant" and submit the search request.
Much to celebrate
 Here are some numbers on ethnic diversity and religious backgrounds in Canada.
- 67.3% — The proportion of people in Canada who reported that they were affiliated with a Christian religion.
- 1.0% — The proportion of people in Canada who reported that they were affiliated with a Jewish religion.
- 0.9% — The proportion of people in Canada who reported their ethnic origin as Jewish.
- 2.3% — The proportion of people in Canada who reported their ethnic origin as African.
- 1.6% — The proportion of people in Canada who reported their place of birth as Africa or a country within Africa.
- 1.1% — the proportion of people in Canada who reported that they were affiliated with a Buddhist religion.
- 1.4% — the proportion of people in Canada who reported that they were affiliated with a Sikh religion.
- 3.2% — the proportion of people in Canada who reported that they were affiliated with a Muslim religion.
- 1.5% — the proportion of people in Canada who reported that they were affiliated with a Hindu religion.
For more information on religion in Canada, consult: Immigration, place of birth, citizenship, ethnic origin, visible minorities, language and religion; Society and community: Religion in Statistics by subject.
Video – Canadian immigration statistics
 Statistics Canada produces videos on a variety of topics that make complex information and ideas easy to interpret by telling a visual story.
Here is a short animated video titled "A Statistics Canada Minute - Immigration and Diversity".
Recent changes in demographic trends in Canada
Canada's population growth masks some very different trends from one region to another. Using various data sources, including Statistics Canada's most recent projections on population and diversity, the article Recent changes in demographic trends in Canada provides a general overview of these trends and discusses how recent demographic changes could impact the age structure, diversity and population share of the various regions of Canada over the next decades.
Population growth in the provinces and territories can be broken down into three factors: natural increase, international migratory increase and interprovincial migratory increase.
Here are some highlights:
- Natural increase to population growth remains positive, but varies across provinces and territories. Natural increase is still the main factor in Nunavut's population growth, as the fertility rate in this territory is close to three children per woman on average, but it no longer contributes to population growth in the Atlantic provinces where, in 2014, Newfoundland and Labrador, Nova Scotia and New Brunswick saw more deaths than births.
- The major increase in the population growth rate of Saskatchewan and Manitoba in recent years is primarily attributable to international migratory increases, as these two provinces have been attracting proportionally more international immigrants than in the past.
- At the same time, fewer immigrants than in the past are choosing to settle in Ontario, which partially explains the slowdown in that province's population growth. For the first time since 1972, Ontario's international migratory increase rate was not above the national average in recent years.
- Alberta's strong population growth in recent years has been the result of a combination of strong natural increase, strong international migratory increase and strong interprovincial migratory increase (Alberta was the main beneficiary of migratory exchanges between the provinces and territories in recent years).
Also worth a read
Mixed unions in Canada. Most mixed unions involved partners who were born in different countries, with one spouse or partner born in Canada and the other born outside Canada (49.2%). About one in five (19.4%) were mixed unions where both were foreign-born, but from different countries.
A newly released publication entitled Immigrant Women provides information that can begin to shed light on the diverse circumstances and experiences of immigrant women in Canada. The publication Women in Canada provides an unparalleled compilation of data related to women's family status, education, employment, economic well-being, unpaid work, health, and more.
Numbers in focus
Every month we put a couple of interesting numbers in the spotlight!
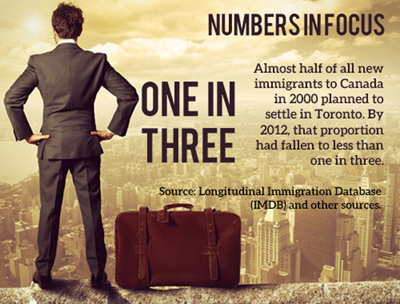
Numbers in Focus - One in Three
Almost half of all new immigrants to Canada in 2000 planned to settle in Toronto. In 2012, that proportion had fallen to less than one in three.
Source: Longitudinal Immigration Database (IMDB) and other sources.
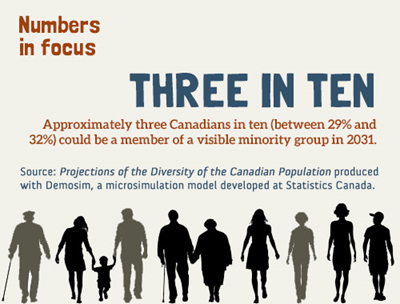
Numbers in Focus - Three in Ten
Approximately three Canadians in ten could be a member of a visible minority group in 2031.
Source: Projections of the Diversity of the Canadian Population produced with Demosim, a microsimulation model developed at Statistics Canada
- Date modified: