
The Business & Community Newsletter – March 2017

Archived Content
Information identified as archived is provided for reference, research or recordkeeping purposes. It is not subject to the Government of Canada Web Standards and has not been altered or updated since it was archived. Please "contact us" to request a format other than those available.
Feature articles
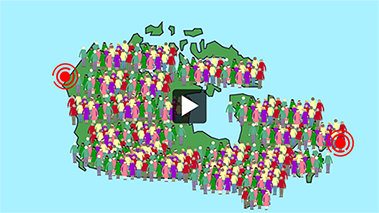
2016 Census population and dwelling counts
The first dataset from the 2016 Census was released on February 8. You can find all the census highlight tables on our website.
The article in the February 8 edition of The Daily describes the main population and dwelling counts at the national, provincial and territorial levels, as well as for some large census metropolitan areas (CMAs) and census agglomerations.
In addition, we have many tools to help you start generating portraits of your community.
Two short Census in Brief articles focus on aspects of these counts that are relevant from a public policy perspective:
- Municipalities in Canada with the largest and fastest-growing populations between 2011 and 2016
- Municipalities in Canada with population decreases between 2011 and 2016
Two videos provide an overview of the long-term trends in population growth and those expected in the future (from 1861 to 2061).
2016 Census: 150 years of population growth in Canada takes a historical look at the population counts of Canada, from 1871 to 2016.

2016 Census: 150 years of urbanization in Canada presents key results of the 2016 Census in terms of population counts, with a focus on cities.
An infographic provides a quick glance at some key findings from the 2016 Census population and dwelling counts, including population growth between 2011 and 2016 for Canada, the provinces and territories, and a few large CMAs.
Census profile
The Census Profile is a resource that provides the profile of selected areas (you can search by place name, postal code or geographic code) with characteristics such as population, age, sex, dwellings, families, marital status and language. For the 2016 Census, the profile will be completed as the data are released.
GeoSearch
GeoSearch is an interactive map product that makes it easy to find places in Canada and get basic geographic and demographic data for them.
Focus on Geography Series, 2016 Census
Focus on Geography Series, 2016 Census is a product that focuses on a selected geographic area to present data highlights through text, tables and figures.
Census Data Navigator
 The Census Data Navigator is a dynamic application that provides the ability to navigate through a map of Canada to obtain population and dwelling counts and data on selected characteristics from the 2016 Census.
For more details about the information released, please see the Release and Concepts Overview to learn about the concepts, definitions and key indicators used for each of the 2016 Census of Population releases, and about the products that will be available on each release day and later.
The next data release will be on May 3, 2017. It will focus on age and sex variables, and types of dwellings. The complete release schedule is available on the Census Program module on our website.
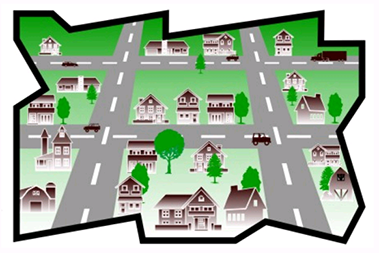
Geography: The foundation of the census
 Organizing a census in a country as large and regionally diverse as Canada is a major undertaking. Census geography covers a wide range of geographic levels—from a national perspective down to city blocks. To take full advantage of census data, users need to have a basic understanding of the terms related to geography concepts.
This is why Statistics Canada provides reference documents. They help users better understand the geographic concepts, products and services that meet their needs for census and other data. Most geography products are accompanied by a reference guide that describes their content, applications, data quality and record layouts. The “Geography” portion of Census Dictionary and the Illustrated Glossary are especially useful. The latter even includes tutorials with each definition!
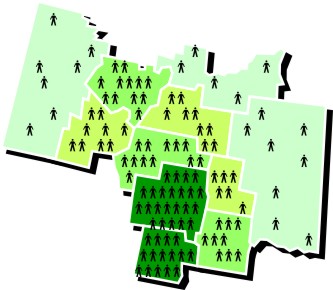
Maps
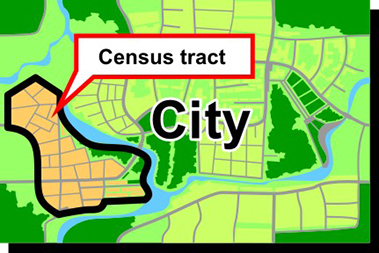 It is impossible to talk geography without discussing maps. For the 2016 Census, Statistics Canada is publishing several types of maps.
Thematic maps show the spatial distribution of one or more specific data themes for standard geographic areas. The data may be qualitative in nature (e.g., predominant mother tongue) or quantitative (e.g., percentage population change).
Reference maps illustrate the location of standard geographic areas for which census statistical data have been tabulated and disseminated. The maps display the boundaries, names and unique identifiers of standard geographic areas, as well as major cultural and physical features, such as streets, railroads, coastlines, rivers and lakes.
Need help?
Statistics Canada makes all these products available online at no charge. But, sometimes, you may want to talk to someone to get the additional information or assistance you need to make your research outstanding. To meet this demand, we offer custom services and workshops for a small fee.
Our agents are available Monday to Friday (except holidays) from 8:30 a.m. to 4:30 p.m. (local time), at 1-800-263-1136 (toll free) or 1-514-283-8300 (international). You can also complete the online request form or email us at STATCAN.infostats-infostats.STATCAN@canada.ca.
Quiz
To celebrate the first release, we have prepared this quiz featuring some interesting highlights. Test your research skills (hint: highlight tables). You'll find the answers at the end of the newsletter.
National
- Which province had the highest population density in 2016?
- Prince Edward Island
- Ontario
- Alberta
- Quebec
- Rank the following provinces and territories by percentage increase in population from 2011 to 2016, from highest to lowest.
- Nunavut
- Yukon
- Saskatchewan
- Nova Scotia
Atlantic
- Which municipality (census subdivision) in the Atlantic provinces had the largest population in 2016?
- Charlottetown, Prince Edward Island
- Halifax, Nova Scotia
- Saint John, New Brunswick
- St. John's, Newfoundland and Labrador
- Of the four Atlantic provinces, which had the largest percentage change in population (increase or decrease)?
- New Brunswick
- Nova Scotia
- Prince Edward Island
- Newfoundland and Labrador
Ontario
- How many census metropolitan areas are there in Ontario?
- 33
- 16
- 9
- 22
- What was the most populous census agglomeration in Ontario in 2016?
- Brockville
- Chatham-Kent
- Sault Ste. Marie
- Kawartha Lakes
Quebec
- What was the percentage change in population for the Montréal census metropolitan area from 2011 to 2016?
- 5.2%
- -5.2%
- 2.3%
- 4.2%
- Rank these Quebec CMAs by 2016 population, from highest to lowest.
- Montréal
- Sherbrooke
- Saguenay
- Québec
Western provinces
- Which of the following Prairie provinces had the largest percentage increase in population between 2011 and 2016?
- Saskatchewan
- Alberta
- Manitoba
- Which Western province had the highest population density in 2016?
- Manitoba
- Saskatchewan
- Alberta
- British Columbia
- How many people per square kilometre were there in British Columbia in 2016?
- 4.8
- 5.0
- 5.2
- 68.5
- Nationally, where did the Vancouver census metropolitan area rank in terms of population in 2016?
- First
- Second
- Third
- Fourth
Territories
- Which of the following had a population greater than 40,000 in 2016?
- Nunavut
- Northwest Territories
- Yukon
- All of the above
Also worth reading
Recent releases
StatCan Blog: Measuring the economy, region by region
 The January 30 post on the StatCan Blog, Measuring the economy, region by region, takes a look at Statistics Canada's new annual release on gross domestic product (GDP) at the census metropolitan area level.
In 2014 the agency released its first set of experimental statistics on metropolitan GDP. The release generated so much interest that the program was expanded to produce these data on an annual basis.
The blog post provides an overview of this new product and of how the agency compiles and produces the data.
Health Reports: February 15, 2017
The most recent issue of Health Reports includes two articles:
- Prolonged sedentary time and physical fitness among Canadian men and women aged 60 to 69
- Smoking prevalence among Inuit in Canada.
Online subscriptions to Health Reports are free. Visit MyStatCan to subscribe.
Coming March 31: Canada at a Glance, 2017 edition
Canada at a Glance presents current statistics on demography, education, health and aging, justice, housing, income, the labour market, households, the economy, travel, finance, agriculture, foreign trade, and the environment. This booklet also includes important international comparisons, so that readers can see how Canada stacks up against its neighbours. Updated yearly, Canada at a Glance is a very useful reference for those who want quick access to current Canadian statistics.
Canada at a Glance is available online in HTML and PDF formats. You can also get a paper version small enough to put in your pocket, so you can always have it at hand.
Order online at the Canada at a Glance homepage or by contacting your regional office.
Answers to the quiz:
- a. Prince Edward Island had the highest population density, at 25.1 people per square kilometre.
- Nunavut (12.7%), Saskatchewan (6.3%), Yukon (5.8%), Nova Scotia (0.2%)
- b. The Halifax regional municipality was the largest municipality (census subdivision) in Atlantic Canada, with a total population of 403,131.
- c. Prince Edward Island had the largest percentage change in population in Atlantic Canada, with an increase of 1.9%.
- b. There are 16 census metropolitan areas in Ontario.
- b. Chatham-Kent was the most populous census agglomeration in Ontario (102,042), a ‑2.0% change from 2011.
- d. The population of the Montréal census metropolitan area increased by 4.2%, topping the 4 million mark for the first time.
- Montréal (4,098,927), Québec (800,296), Sherbrooke (212,105), Saguenay (160,980)
- b. Alberta had the largest percentage increase in population in the Prairie provinces, with 11.6%. Saskatchewan had a 6.3% increase, while Manitoba followed with a 5.8% increase.
- c. Alberta had the highest density of the Western provinces, with 6.4 residents per square kilometre.
- b. British Columbia had a population density of 5.0 people per square kilometre.
- c. Vancouver was the third-largest census metropolitan area, with a population of 2,463,431. But the city (census subdivision) of Vancouver ranked eighth in population.
- b. The Northwest Territories (41,786) was the only territory with a population greater than 40,000.
- Date modified: