
Data table

Archived Content
Information identified as archived is provided for reference, research or recordkeeping purposes. It is not subject to the Government of Canada Web Standards and has not been altered or updated since it was archived. Please "contact us" to request a format other than those available.
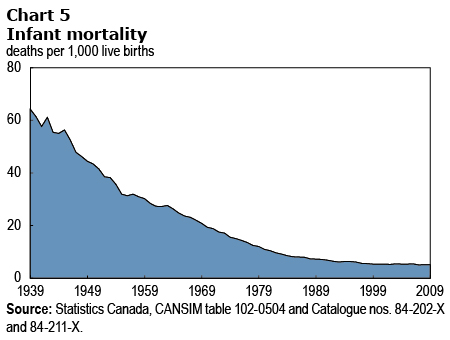
Infant mortality
The title of the graph is "Infant mortality."
This is a line chart.
There are in total 71 categories in the horizontal axis. The vertical axis starts at 0 and ends at 80 with ticks every 20 points.
There are 1 series in this graph.
The vertical axis is "deaths per 1,000 live births."
The units of the horizontal axis are years from 1939 to 2009.
The title of series 1 is "deaths per 1,000 live births."
The minimum value is 4.9 occurring in 2009.
The maximum value is 61.4 occurring in 1939.
| deaths per 1,000 live births | |
|---|---|
| 1939 | 61.4 |
| 1940 | 57.6 |
| 1941 | 61.1 |
| 1942 | 55.4 |
| 1943 | 55.0 |
| 1944 | 56.3 |
| 1945 | 52.5 |
| 1946 | 47.8 |
| 1947 | 46.2 |
| 1948 | 44.4 |
| 1949 | 43.4 |
| 1950 | 41.5 |
| 1951 | 38.5 |
| 1952 | 38.2 |
| 1953 | 35.6 |
| 1954 | 31.9 |
| 1955 | 31.3 |
| 1956 | 31.9 |
| 1957 | 30.9 |
| 1958 | 30.2 |
| 1959 | 28.4 |
| 1960 | 27.3 |
| 1961 | 27.2 |
| 1962 | 27.6 |
| 1963 | 26.3 |
| 1964 | 24.7 |
| 1965 | 23.6 |
| 1966 | 23.1 |
| 1967 | 22.0 |
| 1968 | 20.8 |
| 1969 | 19.3 |
| 1970 | 18.8 |
| 1971 | 17.5 |
| 1972 | 17.1 |
| 1973 | 15.5 |
| 1974 | 15.0 |
| 1975 | 14.3 |
| 1976 | 13.5 |
| 1977 | 12.4 |
| 1978 | 12.0 |
| 1979 | 10.9 |
| 1980 | 10.4 |
| 1981 | 9.6 |
| 1982 | 9.1 |
| 1983 | 8.5 |
| 1984 | 8.1 |
| 1985 | 8.0 |
| 1986 | 7.9 |
| 1987 | 7.3 |
| 1988 | 7.2 |
| 1989 | 7.1 |
| 1990 | 6.8 |
| 1991 | 6.4 |
| 1992 | 6.1 |
| 1993 | 6.3 |
| 1994 | 6.3 |
| 1995 | 6.1 |
| 1996 | 5.6 |
| 1997 | 5.5 |
| 1998 | 5.3 |
| 1999 | 5.3 |
| 2000 | 5.3 |
| 2001 | 5.2 |
| 2002 | 5.4 |
| 2003 | 5.3 |
| 2004 | 5.3 |
| 2005 | 5.4 |
| 2006 | 5.0 |
| 2007 | 5.1 |
| 2008 | 5.1 |
| 2009 | 4.9 |
- Date modified: