
Latest Developments in the Canadian Economic Accounts
Financial and Wealth Accounts on a from-whom-to-whom basis: selected financial instruments

Archived Content
Information identified as archived is provided for reference, research or recordkeeping purposes. It is not subject to the Government of Canada Web Standards and has not been altered or updated since it was archived. Please "contact us" to request a format other than those available.
Skip to text
Text begins
Context for development
The 2008 financial crisis demonstrated how quickly economic shocks can spread between sectors and countries, making it apparent that the existing set of macroeconomic statistics contained gaps in identifying such systemic issues. Users therefore require new products from the System of National Accounts that demonstrate the financial linkages between sectors in the economy. The Special Data Dissemination Plus (SDDS+) and G20 Data Gaps initiatives were established by the International Monetary Fund (IMF) to address some of these data gaps, and presented specific recommendations to G20 countries. One of these recommendations asked statistical agencies to begin compiling more detailed data on the interconnectedness of the economy by incorporating a From-Whom-To-Whom (FWTW) framework. This FWTW framework includes statistics that make counterparty information explicit, showing how various sectors of the economy are connected by financial interdependencies. In other words, the data presented on this new basis allows users to answer the question ‘who is funding whom and with what financial instruments’.
Statistics Canada’s FWTW project builds on the information currently found in the Financial and Wealth Accounts (FWA), the program that is currently responsible for producing Canada’s National Balance Sheet and Financial Flow Accounts. In this release we focus on the government sector and its financial interconnectedness with other sectors in the economy and the rest of the world. We will start by publishing six financial instrumentsNote that are descriptive of the government sectors’ financial position. As the development project continues, more instruments will be released in this format. This will eventually cover all relevant FWA data presented on a FWTW basis and will address the SDDS+ and G20 data gaps recommendations.
Framework
The framework used for the development of FWTW comes from the System of National Accounts 2008 (2008 SNA) manual, and the Financial Production, Flows and Stocks in the System of National Accounts manual. These manuals contain recommendations on the compilation, presentation, classifications, and uses of FWTW data and are developed by the IMF, the Organisation for Economic Cooperation and Development, the United Nations, the World Bank and the European Commission in collaboration with national statistical agencies.
Institutional sectors
All economic agents operating within a domestic territory can be grouped into one of five mutually-exclusive institutional sectors. Economic agents operating outside of the economic territory are classified as non-residents. The institutional sectors listed in the SNA 2008 are groups of similar institutional units, allocated according to the nature of the economic activity they undertake.Note The five main institutional sectors include: the non-financial corporations sector, the financial corporations sector, the general government sector, the non-profit institutions serving household sector, and the households sector. Most of these main sectors also contain many subsectors.
The classification system in the FWA was adapted over time to the Canadian economy’s structure, and therefore does not exactly match the standard presented in the 2008 SNA manual. While the five main sectors align between the two classifications systems, the Canadian system currently has some differences from the international standard at the subsector level. In some cases it is less detailed due to input data limitations and in other cases it contains more detail due to unique features of our economic landscape (for example, the Canadian economy includes a chartered banking sector, which does not exist for other countries). The international framework recognizes that “each of the five institutional sectors listed above may be divided into subsectors. No single method of subsectoring may be optimal for all purposes or all countries, so that alternative methods of subsectoring are recommended for certain sectors”.Note In the long-term, as more data sources become available allowing for the delineation of certain sectors, the Canadian sector classification system will become more closely aligned to the international standard.
Financial instruments
Financial assets are defined as “entities over which ownership rights are enforced by institutional units, individually or collectively, and from which economic benefits may be derived by their owners by holding them, or using them over a period of time; they differ from other assets in the SNA in that there is a counterpart liability on the part of another institutional unit”.Note Likewise, a financial liability is defined as an item that “(1) requires a debtor to make a payment, or payments, to a creditor in circumstances specified in a contract between them; or (2) specifies certain rights or obligations between the two parties, the nature of which requires them to be treated as financial.”Note
Similar to sector classifications, the 2008 SNA has a classification system for financial instruments that the FWA uses as a basis for its own system. The eight main financial instruments in the 2008 SNA are: monetary gold and special drawing rights, currency and deposits, debt securities, loans, equity and investment fund shares, insurance pension and standardized guarantee schemes, financial derivatives and employee stock options, and other accounts receivable. The FWA currently publishes 42 financial instruments and sub-instruments. Certain sub-instruments, such as federal government bonds and provincial government bonds appear in the Canadian system but are not in the international version as they are unique to the Canadian economy.
The main concept that applies to FWTW data is that of the counterparty relationship. All financial instruments contain a relationship between two parties; the first party is the creditor (or asset sector), and the second party is the debtor (or liability sector). The purpose of a financial instrument is to connect economic agents that have capital with those that need capital. This relationship is shown in Figure 1.
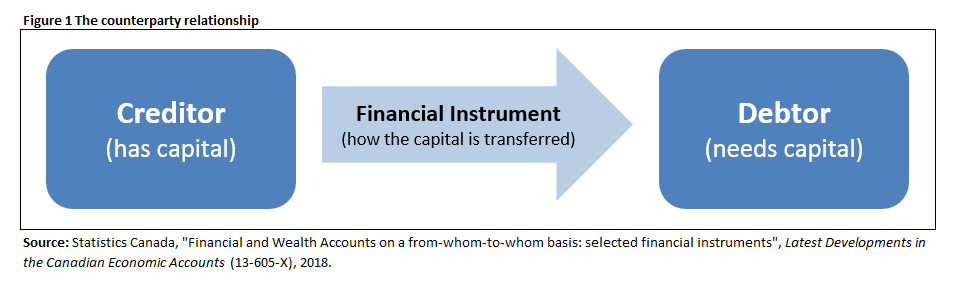
Description for Figure 1
Figure 1 depicts the flow of capital funds between a borrower and a lender. The creditor (lender) owns capital and can transfer it in the form of a financial instrument to a debtor (borrower) who needs capital for current expenditure or investment. The relationship between these two parties forms the basis of from-whom-to-whom statistics, as this data aims to measure the size of the financial connection between sectors of the Canadian economy.
Every dollar lent by an agent in the economy is a dollar borrowed by another agent. It follows from that relationship that, for each instrument, the total assets held by all sectors is equal to the total liabilities owed by all sectors. This balancing property is a central identity to the FWA accounting system.
Applying the From-Whom-to-Whom framework to the Financial and Wealth Accounts
The FWA records the financial flows and other economic flows that either increase or decrease a sector's wealth, in a given reference period (these are the Financial Flow Accounts and the Other Changes in Assets Accounts), as well as the stock of assets and liabilities at the beginning and the end of that period (these are the Balance Sheet Accounts). The balance sheet accounts also show the net worth for each sector of the economy.Note
Current FWA data contains the financial assets and liabilities of each institutional sector, for example the total amount of residential mortgage loans outstanding for the household sector. However there is no explicit counterparty information; who did households borrow the money from? While the balancing property indicates a degree of implicit counterparty information, the From-whom-to-whom presentation makes these sectoral linkages explicit and therefore allows for clearer, more detailed analysis of financial risk in the economy. More specifically, the FWA currently contains tables with four dimensions: sector, instrument, account, and time. The FWTW tables add one more dimension, the counterparty sector. Following the mortgage example previously described, this new dimension will tell us how much each sector lent (in the form of mortgages) to the household sector—chartered banks, other financial institutions, governments, etc. Table 1 shows an example matrix for one instrument, in one account, at one period in time to compare the data available in the FWA vs. FWTW.
| Liability sector by residency and by resident sector | ||||||
|---|---|---|---|---|---|---|
| Residents | Non-residents | Total assets | ||||
| Non-financial corporations | Financial corporations | General government | Households and Non-profit institutions serving households (NPISH) | |||
| Asset sector by residency and by resident sector | ||||||
| Residents | To be populated | To be populated | To be populated | To be populated | To be populated | Data already in Financial and Wealth Accounts (FWA) |
| Non-financial corporations | To be populated | To be populated | To be populated | To be populated | To be populated | Data already in FWA |
| Financial corporations | To be populated | To be populated | To be populated | To be populated | To be populated | Data already in FWA |
| General government | To be populated | To be populated | To be populated | To be populated | To be populated | Data already in FWA |
| Households and NPISH | To be populated | To be populated | To be populated | To be populated | To be populated | Data already in FWA |
| Non-residents | To be populated | To be populated | To be populated | To be populated | To be populated | Data already in FWA |
| Total liabilities | Data already in FWA | Data already in FWA | Data already in FWA | Data already in FWA | Data already in FWA | Data already in FWA |
| Source: Statistics Canada, "Financial and Wealth Accounts on a from-whom-to-whom basis: selected financial instruments", Latest Developments in the Canadian Economic Accounts (13-605-X), 2018. | ||||||
Table 2 shows a situation where a person decides to buy a house but does not have the total amount needed to pay. This person takes out a mortgage loan, for instance a mortgage from a chartered bank worth $500,000. The person becomes a debtor because they needed capital to buy the house, the bank becomes a creditor because it lent the capital, and the means by which this capital was transferred is the mortgage loan. The value of this mortgage loan would appear in the cell which intersects the financial corporations sector and the household sector.
In FWTW terminology, the answer to the question ‘who is funding whom and with what financial instruments’ is ‘the banking sector funded the household sector with mortgage loans’. Total mortgage loan assets owned by all sectors must equal total mortgage loan liabilities owed by all sectors. Table 2 depicts the appearance of this mortgage loan in the balance sheet account matrix.
| Liability sector by residency and by resident sector | ||||||
|---|---|---|---|---|---|---|
| Residents | Non-residents | Total assets | ||||
| Non-financial corporations | Financial corporations | General government | Households and Non-profit institutions serving households (NPISH) | |||
| dollars | ||||||
| Asset sector by residency and by resident sector | ||||||
| Residents | 0 | 0 | 0 | 0 | 0 | 0 |
| Non-financial corporations | 0 | 0 | 0 | 0 | 0 | 0 |
| Financial corporations | 0 | 0 | 0 | 500,000 | 0 | 500,000 |
| General government | 0 | 0 | 0 | 0 | 0 | 0 |
| Households and NPISH | 0 | 0 | 0 | 0 | 0 | 0 |
| Non-residents | 0 | 0 | 0 | 0 | 0 | 0 |
| Total liabilities | 0 | 0 | 0 | 500,000 | 0 | 500,000 |
| Source: Statistics Canada, "Financial and Wealth Accounts on a from-whom-to-whom basis: selected financial instruments", Latest Developments in the Canadian Economic Accounts (13-605-X), 2018. | ||||||
A From-Whom-to-Whom analysis of Government of Canada bonds
FWTW statistics permit the evaluation of systemic risk in specific markets; the mortgage market, bond market etc. Similar to FWA analysis, the data is compiled by instrument so analysts can determine how the risk associated with a specific instrument is shared among sectors. This data is compiled as a time series so analysts may also look at the composition of debt and how it changes over time. For example, if we examine the outstanding balance of government bonds in 1990 compared with 2018 we can determine if there have been any changes in who is supplying funds to the government.
As we can see in Chart 1, the amount of Government of Canada bonds issued by the federal government has increased significantly over the last three decades. In the third quarter of 2018, the value of federal government bonds outstanding was $611.9 billion, compared with $177.4 billion in the first quarter of 1990.
Data table for Chart 1
| 1st quarter of 1990 | 1st quarter of 2000 | 1st quarter of 2010 | 3rd quarter of 2018 | |
|---|---|---|---|---|
| millions of $ | ||||
| Federal general government | 177,367 | 370,797 | 421,073 | 611,865 |
| Non-residents | 48,860 | 88,091 | 76,981 | 194,716 |
| Households | 50,961 | 51,523 | 26,411 | 17,345 |
| Trusteed pension plans | 28,355 | 76,079 | 100,347 | 121,250 |
| Chartered banks | 4,099 | 38,831 | 48,503 | 37,531 |
| Total monetary authorities | 9,980 | 20,911 | 33,382 | 78,787 |
| Other sectors | 35,112 | 95,362 | 135,449 | 162,236 |
| Source: Statistics Canada, "Financial and Wealth Accounts on a from-whom-to-whom basis: selected financial instruments", Latest Developments in the Canadian Economic Accounts (13-605-X), 2018. | ||||
Households held the largest share of bonds in the first quarter of 1990 (28.7%), followed by non-residents (27.5%) and the trusteed pension plan sector (16.0%). In the following years households started holding fewer bonds while non-residents and trusteed pension plans sectors began increasing their holdings of Government of Canada bonds. These two sectors then became the largest counterparties. In the first quarter of 2000, non-residents held the largest share of these bonds. Households still held $51.5 billion, but that only accounted for 13.9% of the total bonds outstanding. The share of bonds held by chartered banks and total monetary authorities was variable over the time period. By the third quarter of 2018, households held only 2.8% of the total bonds issued. The top three sectors in the “other” category for that quarter were provincial and territorial general government, property and casualty insurance companies and other mutual funds.
The decrease of federal government bonds held by households was partly due the decline of the Canada Savings Bonds program. Canada Savings Bonds were introduced in 1946 and followed the Victory Bonds program that helped finance the Canadian effort in the two world wars. In the first quarter of 1990, Canada Savings Bonds accounted for 54.4% of total bonds held by households and 23.0% of all bonds issued by the federal government. Starting in the early 1990s, however, the demand for these bonds declined because of the availability of other investment opportunities. On November 1st 2017, the Government of Canada discontinued the issuance of Canada Savings Bonds.
On the other hand, non-residents increased their holdings of federal government bonds, over the same period. Following the global recession of 2008, Canadian banks and the Government of Canada established a reputation for financial stability which in turn increased the attractiveness of their debts on the global market.
The previous analysis can be conducted with a new data visualisation tool that has been released online (pivot table tool). This tool includes an online pivot table (or dynamic cross-table) as well as other visualization tabs that illustrate different perspectives of the same data.
With this pivot table tool, variables can be dragged to columns or rows of the table as well as outside the table to become a filter. This allows users to view the FWTW data in every dimension.
For example, to examine government bond issuances over time to see if there have been any changes in who is supplying funds to the government, make the following selections in the pivot table.
- For the Sector, debtor (liabilities), select Federal general government, because this is the sector that issues the bonds.
- For the Accounts, select Closing balance sheet, because this shows us the outstanding amounts at the end of a period.
- For the Instrument, select Government of Canada bonds.
- Drag the periods to the rows of the table and in this case select Q1 1990, Q1 2000, Q1 2010 and Q3 2018 to see how the outstanding amounts have evolved over time.
- Drag the Sectors, creditor (assets) to the columns to select the largest sectors that are the holders of the bonds. In this case, the thirteen-largest creditor sectors over time were selected.
After making all these selections, the pivot table will look like Figure 2, which corresponds to the data presented in the previous analysis.
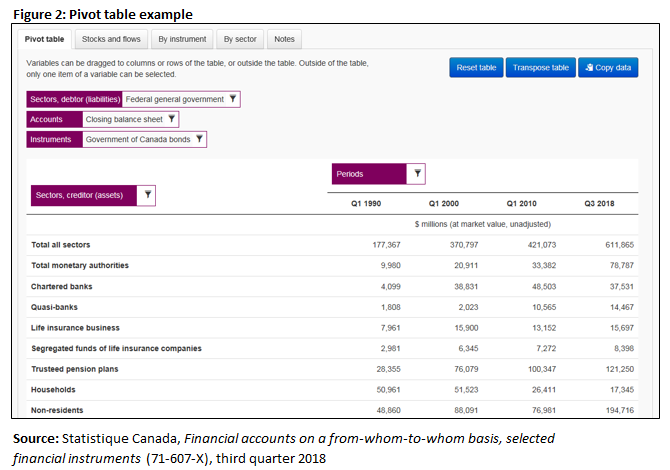
Description for Figure 2
Figure 2 depicts an example of analysis using a dynamic pivot-table tool. This tool contains a fully customizable table where users have control over the placement of all dimensions related to From-Whom-to-Whom data. The example shown is used to analyse the counterparties for Government of Canada bonds issued by the Federal Government, and how these holdings change over time.
Summary and future development
The current FWA tables clearly indicate the level of debt held by various sectors of the Canadian economy which is a useful indicator of financial vulnerability. However, without detail on who this debt is owed to it becomes difficult to trace the impact of economic shocks throughout the rest of the economy. By expanding the FWA to include FWTW detail, analysts and policymakers can perform more robust forecasting and analysis of intersectoral financial flows and examine which sectors and instruments are subject the most financial risk.
The short-term focus of this development work will be to inform users of the necessary concepts and tools required to make of the most of this new detailed data. In order to make this information more easily accessible, we have produced a pivot table tool for a selected subset of financial instruments in the FWA, presented on a FWTW basis. We encourage users to try this tool (hyperlink available in the previous section) to see how various forms of matrix presentations can be useful for understanding FWA data in new ways.
Development will continue on an ongoing basis, and will include the more complex instruments. Our priority is to prepare for the specific requirements set out by SDDS+ and the G20 Data Gaps initiatives, while also setting up the necessary statistical infrastructure for long-term data production in FWTW format. As the development work continues on an instrument-by-instrument basis, new information will be used to clarify existing FWA statistics so that both accounting frameworks align exactly and will always be directly comparable.
The long-term goal is for all FWA data to be presented on a FWTW basis, on a quarterly basis. With each subsequent FWA release, additional FWTW detail will also be released until Canada's international commitments are met, which consist mainly of FWTW matrices for the ‘other financial corporations’ sector in the year 2021. Once the FWTW is developed for all instruments in the FWA, Canada’s financial system will be described with detailed counterparty information. Analysts and policymakers will be able to fully assess the level of financial interconnectedness between sectors and with the rest of the world.
Appendix
Methodology: deriving From-Whom-to-Whom tables from the Financial and Wealth Accounts
In general, moving from FWA statistics to a FWTW framework follows these steps, working within the matrix structure as shown in the previous examples. The number of steps depends on the number of possible counterparty relationships for a particular instrument, and how much counterparty information is available in existing data sources. This methodology will be followed during the development phase of the project, however once the FWTW is fully developed a combination of top-down and bottom-up approaches will be used, depending on the data availability for each instrument.
- Creation of a matrix for a particular account and time period: identify all cells by crossing all dimensions (sector by sector by instrument).
- Elimination of non-applicable cells (for example if certain sectors cannot issue a particular instrument).
- Estimation of values of interior cells using available detail wherever possible.
- Currently published FWA data will appear as row and column totals.
- Identifications of data sources with counterparty information to fill in interior cells.
- For remaining cells, estimation via ratio assumptions or residual calculations
Additional examples
Simple cases: ‘one-to-one’ and ‘one-to-many’ instruments
These instruments include items such as government bonds or international reserves, where only one sector can hold the liability or the asset. This means that moving from an FWA basis to FWTW requires only a re-mapping of existing FWA data. Users with advanced knowledge of FWA data would be able to build such a matrix using currently published data. For example, by finding the international reserve assets of financial corporations (for example let’s assume $100 in Table 3) and knowing that this must be equal to the international reserve liabilities of non-residents, it is easy to simply place the same number in the cell where these two sectors intersect.
| Liability sector by residency and by resident sector | ||||||
|---|---|---|---|---|---|---|
| Residents | Non-residents | Total assets | ||||
| Non-financial corporations | Financial corporations | General government | Households and Non-profit institutions serving households (NPISH) | |||
| dollars | ||||||
| Asset sector by residency and by resident sector | ||||||
| Residents | Note .: not available for any reference period | Note .: not available for any reference period | Note .: not available for any reference period | Note .: not available for any reference period | Note .: not available for any reference period | Note .: not available for any reference period |
| Non-financial corporations | Note .: not available for any reference period | Note .: not available for any reference period | Note .: not available for any reference period | Note .: not available for any reference period | Note .: not available for any reference period | Note .: not available for any reference period |
| Financial corporations | Note .: not available for any reference period | Note .: not available for any reference period | Note .: not available for any reference period | Note .: not available for any reference period | 100 | 100 |
| General government | Note .: not available for any reference period | Note .: not available for any reference period | Note .: not available for any reference period | Note .: not available for any reference period | Note .: not available for any reference period | Note .: not available for any reference period |
| Households and NPISH | Note .: not available for any reference period | Note .: not available for any reference period | Note .: not available for any reference period | Note .: not available for any reference period | Note .: not available for any reference period | Note .: not available for any reference period |
| Non-residents | Note .: not available for any reference period | Note .: not available for any reference period | Note .: not available for any reference period | Note .: not available for any reference period | Note .: not available for any reference period | Note .: not available for any reference period |
| Total liabilities | Note .: not available for any reference period | Note .: not available for any reference period | Note .: not available for any reference period | Note .: not available for any reference period | 100 | 100 |
|
. not available for any reference period Source: Statistics Canada, "Financial and Wealth Accounts on a from-whom-to-whom basis: selected financial instruments", Latest Developments in the Canadian Economic Accounts (13-605-X), 2018. |
||||||
In this case the only entity that holds international reserve assets is the Bank of Canada (which is classified under the financial corporations sector) and the only sector that owes international reserves as a liability are non-residents. While this data can be easily found in the FWA, the added benefit to FWTW presentation is that the counterparty relationship is made explicit by also showing the data in a cross-section of the relevant counterparty sectors.
Complex cases: ‘many-to-many’ instruments
In the cases of more complex instruments (for example, loans) many sectors can hold the instrument as an asset and many sectors can hold the instrument as a liability. When almost every sector can hold the asset and the liability it becomes challenging to deduce the interior of the matrix from currently published FWA totals. Therefore, more detailed counterparty data sources must be incorporated on a sector by sector basis. The exact methodology for each cell will change depending on source data.
- Date modified: