
Latest Developments in the Canadian Economic Accounts
Methodology for exports of energy products within the International Merchandise Trade Program
Energy products are among the most important contributors to Canada’s total trade values, and the vast majority of Canada’s trade in energy products is with the United States. Compared with other goods, energy products are unique in terms of how they can be transported across the border, and this presents some challenges in how they are accounted for within customs documentation. The following text outlines how merchandise export values are produced for three important products: crude oil, natural gas and electricity. For these products, sources and methods can be very different than those typically used to measure exports of goods.
Background
International merchandise trade statistics are based primarily on customs declarations submitted at the time goods are imported or exported. Statistics Canada has a unique arrangement with the United States, through which import information from one country is used to produce export statistics for the other. Statistics Canada and the United States Census Bureau release data simultaneously at 8:30 AM Eastern Time on pre-established dates, which occur on average 35 days after the close of the reference month. Customs basis statistics, which are based on physical movement of goods between countries, are coherent between the two countries for the reference month being released. For balance of payments basis (BoP) statistics, which are based on ownership changes between residents and non-residents, adjustments are made to customs basis statistics to bring them in line with balance of payments concepts, and it is these statistics that enter into the Canadian Macroeconomic Accounts.
Exceptions for continuous transmission commodities
For continuous transmission commodities (CTCs) – goods that flow continuously through pipelines or transmission wires, such as crude oil, natural gas and electricity – some exceptional processes exist for compiling statistics. Generally, importers of these commodities are afforded more flexibility from customs agencies in terms of the timing and granularity of reported shipments, and in some cases this can lead to less reliability in collected data.
For customs basis crude oil exports, monthly data compiled from US import data and Canada Border Services Agency (CBSA) export declarations (in the case of non-US exports) are the primary input sources. While the resulting aggregate statistics are coherent with those produced by other organizations over longer periods of time, there is more month-to-month variability evident in the customs figures, which suggests that exports are not always allocated in the same month as they are in other sources.
While customs basis statistics for Canadian crude oil exports to the United States are sourced from US import documents like most other commodities, for exports of natural gas and electricity, there is no US import information available. Exceptionally for these commodities, export statistics are compiled from other sources (which are described below in the sections for these products) and subsequently shared with the United States Census Bureau.
For the reasons above, exports of CTCs are measured using sources other than customs documents. This is the case on both the customs and balance of payments bases for natural gas and electricity, and also for balance of payments basis crude oil exports.
Methodology for balance of payments basis crude oil exports
For most products, relatively small balance of payments adjustments are applied to customs basis values to arrive at a valuation that represents BoP concepts. In the case of crude oil exports, BoP values are computed independent of customs basis values, using different inputs. The BoP value for crude oil exports is implicitly calculated from the exported volume multiplied by the average export price.
For the volume component of the BoP crude oil export value calculation, methods have remained relatively stable. For exports to the United States, which covers the vast majority of Canadian exports, information comes from survey-based data published by Statistics Canada’s Crude Oil and Natural Gas (MCONG) program. In recent years non-US export volumes from this program have been replaced by customs data. Non-US exports shipments are sent by vessel, and the accounting for these shipments in customs documents isn’t subject to the same challenges as CTC shipments.
For the BoP crude oil price component, a change in methods occurred in 2020. For statistics prior to January 2018 reference month, the export price used was the monthly average acquisition cost, provided by the Canada Energy Regulator (then National Energy Board). The acquisition cost generally represents the price of the goods at the time they are loaded into a conveyance (pipeline, rail car, tanker vessel) for export. This aligns well with the BoP concept for goods valuation, which excludes transportation costs from specific commodity categories. Instead these costs are combined across products and included in the ‘Special Transactions – Trade’ category.
Following a thorough review of the methodology for BoP crude oil export compilation, which included close collaboration with the Canada Energy Regulator (CER), in June 2020 this methodology was updated for reference year 2020. Statistics for 2018 and 2019 were later revised in accordance with the revision policies for the statistical programs that include BoP basis merchandise trade as an input, as the new methodology resulted in material differences for these years.
The price used in the current methodology continues to come from the CER, but the average acquisition cost has been replaced by a weighted average of the CER export price, another variable collected from exporters. The export price variable, while not as well aligned with BoP concepts for valuation as the acquisition cost, has been deemed to be better understood by exporters, and therefore likely yields more reliable data. Average prices for heavy and light crude oil are calculated using transaction volumes as weights. Prior to calculating these weighted averages, the transactions are reviewed for errors with the aid of automated outlier detection routines. Furthermore, to arrive at the correct valuation for the balance of payments basis, transportation costs to the Canadian border must be stripped from the price. These costs are estimated using publically available pipeline toll rates, and for rail shipments, the data most recently published under the Canadian Freight Analysis Framework (CFAF). A final balance of payments basis price is computed from the average heavy and light crude oil prices, and combined with volume information to calculate the BoP value. This price is also converted to a price index, and published explicitly in Statistics Canada data tables.
Chart 1 illustrates the impact of the change in methodology for reference years 2018 and 2019Note . Depending upon the month, BoP values resulting from the new method may be higher or lower than values previously published, but in general the methodology tends to produce higher values
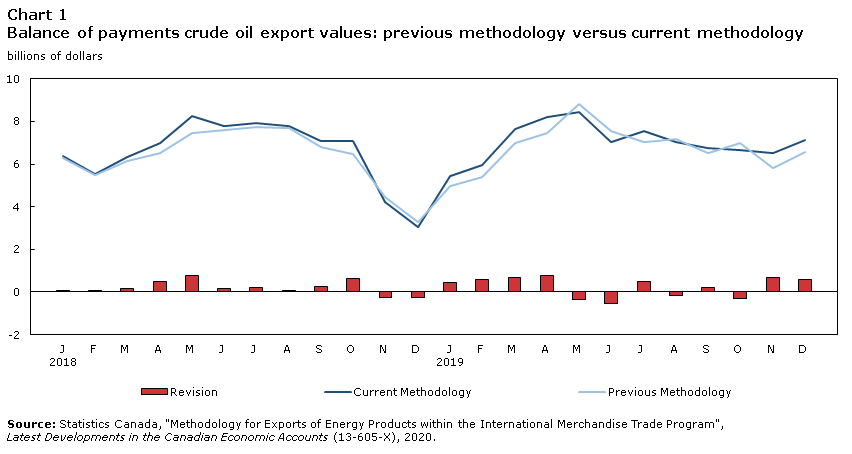
Data table for Chart 1
| Current Methodology | Previous Methodology | Revision | |
|---|---|---|---|
| thousands of dollars | |||
| 2018 | |||
| January | 6,375,057 | 6,286,856 | 88,201 |
| February | 5,539,119 | 5,474,174 | 64,945 |
| March | 6,327,427 | 6,154,215 | 173,212 |
| April | 6,984,092 | 6,512,749 | 471,343 |
| May | 8,251,753 | 7,477,480 | 774,273 |
| June | 7,798,733 | 7,614,841 | 183,892 |
| July | 7,937,860 | 7,718,516 | 219,344 |
| August | 7,776,007 | 7,684,584 | 91,423 |
| September | 7,076,296 | 6,818,069 | 258,227 |
| October | 7,091,728 | 6,482,200 | 609,528 |
| November | 4,233,377 | 4,477,607 | -244,230 |
| December | 3,031,559 | 3,283,907 | -252,348 |
| 2019 | |||
| January | 5,437,786 | 4,977,045 | 460,741 |
| February | 5,950,294 | 5,382,062 | 568,232 |
| March | 7,635,057 | 6,973,844 | 661,213 |
| April | 8,205,464 | 7,439,336 | 766,128 |
| May | 8,449,041 | 8,801,646 | -352,605 |
| June | 7,032,870 | 7,560,009 | -527,139 |
| July | 7,531,002 | 7,026,720 | 504,282 |
| August | 7,028,767 | 7,172,976 | -144,209 |
| September | 6,738,738 | 6,542,790 | 195,948 |
| October | 6,647,934 | 6,971,267 | -323,333 |
| November | 6,502,380 | 5,836,669 | 665,711 |
| December | 7,144,046 | 6,567,294 | 576,752 |
| Source: Statistics Canada, "Methodology for Exports of Energy Products within the International Merchandise Trade Program", Latest Developments in the Canadian Economic Accounts (13-605-X), 2020. | |||
For both the price and volume, most source data are not available in time to be used in statistics for the new month to be published. In the case of prices, data are estimated using a model. With the introduction of new methodology for compiling BoP prices, a new approach for estimating the prices for the latest month was also introduced. This method makes use of a machine-learning algorithm involving a stochastic process. Primary inputs for this model include export prices from previous months, and more timely information in the form of crude oil spot prices and stock market performance indicators. Prior to the change in methodology, prices for the most recent month were forecast using a deterministic model that featured previously published prices, customs unit values and various spot prices as primary inputs. For volumes, timely data are published by the US Energy Information Administration (EIA). The monthly change in EIA volume-based imports from Canada, after factoring in customs results for non-US shipments, is applied to the previous month volume used in the BoP export calculation.
Methodology for natural gas exports
Canada’s exports of natural gas are dominated by exports to the United States. With no natural gas data included in transmissions from the United States Census Bureau, these figures are compiled from other sources for both the customs and balance of payments basis.
Data from Statistics Canada’s MCONG program are used for both the price and volume of natural gas exports. As these data are not as timely as customs data, estimates are used until they are received. Using more timely data from third party sources, and trends in historical data from the MCONG program, estimates for the relative increases to price and volume are applied to the most recent data available. For customs basis data, as results are shared with the USCB well before publication, a much earlier cut-off time exists in comparison with the BoP stream. As a result, prices and volumes are estimated for the prior month as well as the current month in customs basis figures. On a balance of payments basis, by the time estimation must be performed, data from the MCONG program are available for the prior month. Relative price and volume movements for the most recent month are therefore applied to MCONG program data, resulting in price and volume measures that differ on a BoP basis from those available on a customs basis for the most recent reference month as well as the prior month. By the time statistics are compiled for the quarterly Current Account release, data from the Energy Program are often available for the month just released. When this is the case, these figures will be used in place of the estimates for natural gas data within the Current Account release.
Methodology for electricity exports
Similar to natural gas, electricity exports are dominated by exports to the US, and customs documentation is not available. In the case of electricity, statistics are compiled from reports published by the Canada Energy RegulatorNote .
At the time merchandise trade data are released, these CER reports are not available for the most recent month, and so data must be estimated. For electricity, ARIMA models are used to forecast the price and volume for the most recent month, with CER monthly data from the previous 7 years used as inputs. Forecast movements for electricity price and volume are applied to the actual data received for the previous month to arrive at the levels published for the most recent month. The same estimation process is used for both the customs and balance of payments streams. By the time statistics are compiled for the quarterly Current Account release, CER data are sometimes available for the month just released. When this is the case, these figures will be used in place of the estimates for electricity data within the Current Account release.
| Product | Month | Customs basis | Balance of payments basis |
|---|---|---|---|
| Crude oil | Month t | Price: Implicit Volume: Customs data Value: Customs data |
Price: Modelled Volume: EIA monthly change (US exports); Customs data (non-US exports) Value: Implicit |
| Month t-1 | Price: Implicit Volume: Customs data Value: Customs data |
Price CER weighted average Volume: MCONG (US exports); Customs data (non-US exports) Value: Implicit |
|
| Natural gas | Month t | Price: Estimated Volume: Estimated Value: Implicit |
Price: EstimatedTable 1 Note 1 Volume: EstimatedTable 1 Note 1 Value Implicit |
| Month t-1 | Price: Estimated Volume: Estimated Value: Implicit |
Price: Implicit Volume: MCONG Value: MCONG |
|
| Month t-2 | Price: Implicit Volume: MCONG Value: MCONG |
Price: Implicit Volume: MCONG Value: MCONG |
|
| Electricity | Month t | Price: Estimated Volume: Estimated Value: Implicit |
Price: Estimated Volume: Estimated Value: Implicit |
| Month t-1 | Price: Implicit Volume: CER Value: CER |
Price: Implicit Volume: CER Value: CER |
|
|
|||
Revisions
Exports of energy products can be a source of significant revisions in merchandise trade statistics. This is mainly caused by the replacement of estimated data with actual results. Energy products represent a significant share of total exports, and are often driven by volatile prices – particularly in the case of crude oil and natural gas. This volatility makes the estimation process difficult. Natural gas prices in certain markets in the US northeast frequently experience extreme swings, resulting in larger revisions during transitions between seasons or when sudden temperature changes occur. Crude oil prices can change rapidly due to a number of factors in domestic and world markets, with the sudden decline and subsequent recovery in crude oil prices in 2020 providing evidence of the kind of volatility they can be subject to.
Statistics Canada is continually reviewing its data sources and methods used in compiling export statistics for energy products. New approaches will be considered as new sources or techniques emerge, with a view to increasing the quality of statistics and minimizing revisions.
- Date modified: