
Latest Developments in the Canadian Economic Accounts
The 2017 to 2019 Revisions of the Income and Expenditure Accounts
Introduction
This article presents revisions to the Gross Domestic Product (GDP) by Income and by Expenditure Accounts (IEA) for the 2017-to-2019 period. These revisions were also reflected in the 2019 Provincial and Territorial Economic Accounts estimates, which were released on November 9, 2020.
The first and second quarters of 2020 have also been revised. However, in accordance with standard revision practice, these estimates will continue to be revised during upcoming cycles. Therefore, they are excluded from the analysis in this article.
Revisions to IEA components can have an impact on household savings. The last section of this article discusses revisions to household savings for the 2017-to-2019 period.
Revision process
GDP estimates by IEA are subject to three types of revisions. The first incorporates the latest benchmark from the supply-use tables. The second incorporates data from the latest annual surveys and administrative sources. The third, which is performed less frequently, entails incorporation of new concepts, methods, accounting standards, and classification systems. The 2017 to 2019 GDP revisions by IEA include all three types of revisions.
The statistical revisions to GDP reflect the incorporation of the most current data, including survey results, administrative data, public accounts, and annual supply-use tables. These tables integrate data from sources available to Statistics Canada into a rigorous accounting framework. They represent the most detailed, coherent accounting system for the structure of the Canadian economy and are considered the most accurate benchmarks on which to base estimates. In this release, new benchmark values from the supply-use tables for the 2017 reference year have been incorporated into the GDP by IEA. Detailed information from surveys, such as the Annual Survey of Manufacturing and Logging, the Annual Survey of Research and Development in Canadian Industry, and the Annual Census of Mines, as well as government public accounts and tax data, were integrated.
New and updated information from surveys and administrative sources was available for 2018 and 2019, and has been incorporated in this cycle. These included new commodity details from the Retail Commodity Survey, updated estimates from the Annual Balance of Payments Surveys, revised estimates of foreign student enrolment and tourism, and the incorporation of results from the Annual Capital and Repair Expenditures Survey (actual for 2018). Administrative data that were incorporated included the T4 benchmark data for 2018 and preliminary estimates for 2019.
The third type of revision for this cycle reflects a new methodology for estimating international export prices of petroleum, which resulted in an upward revision in prices, impacting nominal GDP for 2018 and 2019.
The GDP revisions reflect overall changes stemming from all sources combined. This article summarizes the impact of these revisions on annual and quarterly GDP, on a nominal and a real basis.
Revisions to growth of nominal gross domestic product
| Revised annual nominal GDP | Previously-published annual nominal GDP | Revision | Revised growth in annual GDP | Previously-published growth in annual GDP | Absolute revision to growth in annual GDP | |
|---|---|---|---|---|---|---|
| billions of dollars | percent | percentage point | ||||
| 2017 | 2,140.64 | 2,141.11 | -0.5 | 5.68 | 5.71 | 0.03 |
| 2018 | 2,231.17 | 2,223.86 | 7.3 | 4.23 | 3.86 | 0.37 |
| 2019 | 2,310.71 | 2,303.88 | 6.8 | 3.57 | 3.60 | 0.03 |
| 2017 to 2019 average | 2,227.51 | 2,222.95 | 4.6 | 4.49 | 4.39 | 0.10 |
| Source: Statistics Canada, "The 2017 to 2019 revisions of the Income and Expenditure Accounts", Latest Developments in the Canadian Economic Accounts (13-605-X), 2020. | ||||||
With the incorporation of new benchmark data from the supply-use tables, the level of nominal GDP was revised down by $0.5 billion in 2017. Consequently, the nominal GDP growth rate underwent a 0.03 percentage-point downward revision. The downward revision resulted largely from the revised business gross fixed capital formation and government final consumption expenditure.
In 2018, the level of nominal GDP was revised upward by $7.3 billion, or 0.37 percentage point. The upward revisions resulted largely from household final consumption expenditure, business gross fixed capital formation, and exports. These increases were partly offset by downward revisions in government final consumption expenditure, coupled with upward revisions in imports.
In 2019, the level of nominal GDP was revised up by $6.8 billion. Because of a higher percentage-point revision in the previous year, the revision in 2019 was 0.03 percentage point. The upward revisions resulted largely from higher household final consumption expenditure, business gross fixed capital formation, and exports. These upward revisions were partly offset by a downward revision in government final consumption expenditure.
The absolute revision to the growth rate—the difference between the revised average growth rate and the previously published average growth rate—was 0.10 percentage point for the 2017-to-2019 period.
| Revised average growth in quarterly GDP | Previously-published average growth in quarterly GDP | Mean absolute revision to growth in quarterly GDP | |
|---|---|---|---|
| percent | percentage point | ||
| 2017 | 1.39 | 1.38 | 0.01 |
| 2018 | 0.57 | 0.54 | 0.03 |
| 2019 | 1.22 | 1.17 | 0.05 |
| 2017 to 2019 average | 1.06 | 1.03 | 0.03 |
| Source: Statistics Canada, "The 2017 to 2019 revisions of the Income and Expenditure Accounts", Latest Developments in the Canadian Economic Accounts (13-605-X), 2020. | |||
On a quarterly basis, the revisions to the growth rates of nominal GDP resulted in small changes relative to the previous estimates in most quarters. The average upward revision was 0.03 percentage point as downward revisions in some quarters largely offset upward revisions in other quarters. These revisions are consistent with historical averages. Throughout the period, the quarterly trend remained similar to the trend based on the previously published estimates.
Revisions to growth of real gross domestic product
| Revised growth in annual real GDP | Previously-published growth in annual real GDP | Absolute revision to growth in annual real GDP | |
|---|---|---|---|
| percent | percentage point | ||
| 2017 | 3.04 | 3.17 | 0.13 |
| 2018 | 2.43 | 2.01 | 0.42 |
| 2019 | 1.86 | 1.66 | 0.20 |
| 2017 to 2019 average | 2.44 | 2.28 | 0.16 |
| Source: Statistics Canada, "The 2017 to 2019 revisions of the Income and Expenditure Accounts", Latest Developments in the Canadian Economic Accounts (13-605-X), 2020. | |||
The mean absolute percentage-point revision to the annual average growth rate of real GDP for the 2017-to-2019 period was 0.16. The revision was lowest in 2017 (-0.13 percentage point) and highest in 2018 (+0.42 percentage point). The growth rate was revised up (+0.20 percentage point) in 2019.
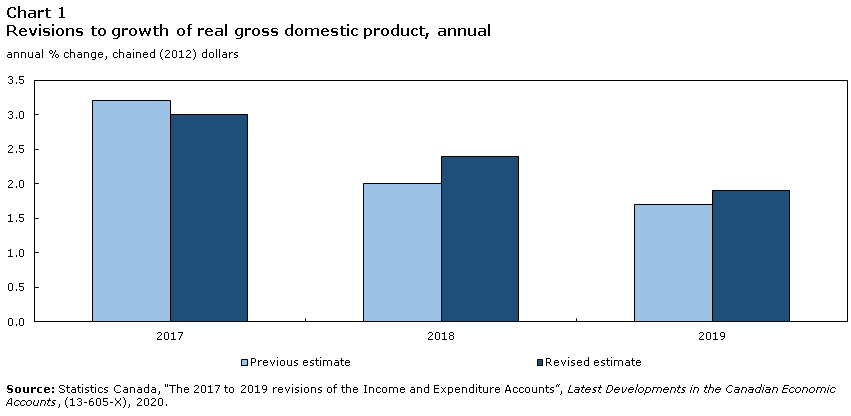
Data table for Chart 1
| Previous estimate | Revised estimate | |
|---|---|---|
| annual percent change, chained (2012) dollars | ||
| 2017 | 3.2 | 3.0 |
| 2018 | 2.0 | 2.4 |
| 2019 | 1.7 | 1.9 |
|
Source: Statistics Canada, "The 2017 to 2019 revisions of the Income and Expenditure Accounts", Latest Developments in the Canadian Economic Accounts, (13-605-X), 2020. |
||
Based on chained dollars, the growth rate of real GDP was revised down by 0.2 percentage points in 2017; up by 0.4 percentage points in 2018, and up by 0.2 percentage points in 2019.
| Revised average growth in quarterly real GDP | Previously-published average growth in quarterly real GDP | Mean absolute revision to growth in quarterly real GDP | |
|---|---|---|---|
| percent | percentage point | ||
| 2017 | 0.76 | 0.78 | 0.02 |
| 2018 | 0.57 | 0.45 | 0.12 |
| 2019 | 0.43 | 0.38 | 0.05 |
| 2017 to 2019 average | 0.59 | 0.54 | 0.05 |
| Source: Statistics Canada, "The 2017 to 2019 revisions of the Income and Expenditure Accounts", Latest Developments in the Canadian Economic Accounts (13-605-X), 2020. | |||
The mean absolute percentage-point revision to the annual average growth rate of quarterly real GDP for the 2017-to-2019 period was 0.05. The revision was lowest in 2017 (-0.02 percentage point) and highest in 2018 (+0.12 percentage point). The growth rate was revised up (+0.05 percentage point) in 2019.
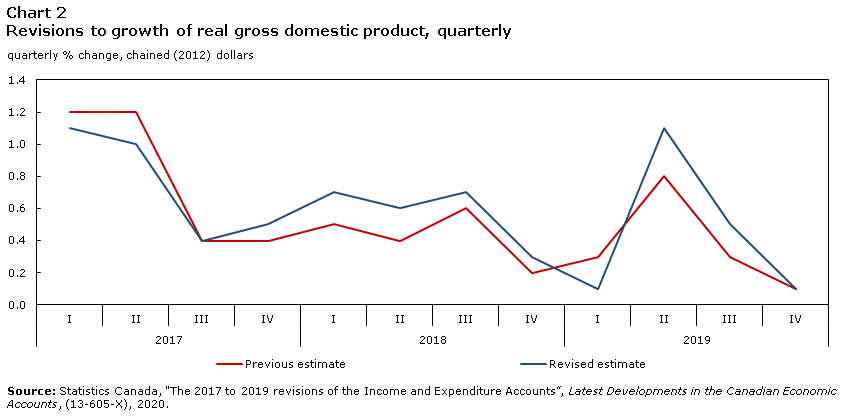
Data table for Chart 2
| Previous estimate | Revised estimate | |
|---|---|---|
| quarterly percent change, chained (2012) dollars | ||
| 2017 | ||
| I | 1.2 | 1.1 |
| II | 1.2 | 1.0 |
| III | 0.4 | 0.4 |
| IV | 0.4 | 0.5 |
| 2018 | ||
| I | 0.5 | 0.7 |
| II | 0.4 | 0.6 |
| III | 0.6 | 0.7 |
| IV | 0.2 | 0.3 |
| 2019 | ||
| I | 0.3 | 0.1 |
| II | 0.8 | 1.1 |
| III | 0.3 | 0.5 |
| IV | 0.1 | 0.1 |
| Source: Statistics Canada, "The 2017 to 2019 revisions of the Income and Expenditure Accounts", Latest Developments in the Canadian Economic Accounts, (13-605-X), 2020. | ||
Based on chained dollars, the movement of real GDP between 2017 and 2019 differed from the previously published estimates. In 2017, quarterly GDP estimates underwent slight downward revisions as a result of the annual downward revision. Downward revisions in the first (-0.1 percentage point) and second quarters (-0.2 percentage point) were partly offset by an upward revision (+0.10 percentage point) in the fourth quarter. There was no revision in the third quarter.
In 2018, real GDP growth rates were revised up in each quarter: 0.2 percentage point in the first and second quarters, and 0.1 percentage point in the third and fourth quarters. In 2019, the real GDP growth rate was revised down (-0.2 percentage point) in the first quarter, followed by upward revisions by 0.3 percentage point in the second and 0.2 percentage point in the third quarter. The growth rate was unchanged in the fourth quarter. The mean absolute revision to the quarterly growth rate of real GDP for the entire period was 0.7 percentage point.
The revisions moved in tandem with revisions in nominal GDP growth rates, reflecting a stable GDP implicit price index for the period.
Revisions to household saving
The household disposable income and saving were impacted by notable revisions for the 2017 to 2019 period. Comprehensive benchmarks were available for a number of estimates based on administrative tax data, annual supply-use tables, and survey data. For example, compensation of employees, transfers to non-profit institutions serving households, and property income received (that is, dividends received from Canadian sources) incorporated aggregated tax data and other sources. Gross-mixed income of non-farm businesses was adjusted to align with the annual supply-use tables. Overall, these changes resulted in a reduction to household disposable income. At the same time, estimates of household final consumption expenditure were revised upward; these two factors, lower disposable income and higher consumption, pushed the household savings rate lower over the period. This revised saving rate reached a low of 0.1% in the third quarter of 2018, but quarterly movements remained consistent.
| Household sector | Summary of changes |
|---|---|
| Compensation of employees | Revised up from 2018 to 2019 as a result of tax-based benchmarks |
| Gross mixed income: Non-farm | Revised down from 2017 onwards as a result of incorporating supply-use benchmarks |
| Property income received | Revised down as a result of tax-based benchmarks for dividends received by households. |
| Household transfers to non-profit institutions serving households | Revised up as a result of tax-based benchmarks relating to donations received by non-profit institutions serving households |
| Household disposable income | Derived estimate; net revision downward |
| Less: household final consumption expenditure | Revised up due to incorporation of supply-use benchmarks and annual survey sources |
| Household saving rate | Derived estimate; net revision downward |
| Source: Statistics Canada, "The 2017 to 2019 revisions of the Income and Expenditure Accounts", Latest Developments in the Canadian Economic Accounts (13-605-X), 2020. | |
- Date modified: