
Agriculture and wildlife: A two-way relationship

Archived Content
Information identified as archived is provided for reference, research or recordkeeping purposes. It is not subject to the Government of Canada Web Standards and has not been altered or updated since it was archived. Please "contact us" to request a format other than those available.

by Sarah Jeswiet and Lisa Hermsen, Agriculture Division
[Release from The Daily] [Full article in PDF]
- What you should know about this study
- What is wildlife habitat?
- Where is wildlife habitat found?
- What types of farms have wildlife habitat?
- How do farmers benefit from wildlife?
- What farm practices benefit wildlife?
Start of text box
Highlights
Agricultural land provides important habitat to a variety of wildlife species, with natural land for pasture, woodlands and wetlands having the highest habitat value. Wildlife supplies many ecosystem services to the Canadian agricultural industry, and Canadian farmers can adopt several agricultural practices that enhance wildlife habitat.
- In 2011, nearly one-third (30.2%) of agricultural land in Canada was wildlife habitat, which represented 19.6 million hectares.
- Three-quarters of wildlife habitat reported by Canadian farmers was natural land for pasture (75.0%), and the remainder was woodlands and wetlands (25.0%).
- Two in five farms (40.3%) reported natural land for pasture while one in two farms (49.9%) reported woodlands and wetlands in 2011.
End of text box
Start of text box
What you should know about this study
This study is based on data from the 2011 Census of Agriculture, which collected data from all agricultural operations that grow or raise livestock, poultry, crops or other agricultural products intended for sale. Respondents were asked to enumerate their commodities, land use and farming practices. This study does not include farms in the territories.
While this article focuses on agricultural land type, it should be noted that other factors such as landscape diversity and connectivity are also important to wildlife habitat availability on agricultural land.
Definitions
Agricultural land represents the total farm area reported in the 2011 Census of Agriculture and includes the following land use categories: cropland, summerfallow, tame or seeded pasture, natural land for pasture, woodlands and wetlands, and all other land.
Cropland represents the areas reported for field crops, hay, vegetables, sod, nursery products, fruits, berries and nuts.
Wildlife habitat refers to two agricultural land use categories: woodlands and wetlands, and natural land for pasture. The category woodlands and wetlands is a combined variable and it is not possible to determine the relative contributions of the two components.
End of text box
What is wildlife habitat?
The Canadian agricultural landscape is a mosaic of different types of land cover, ranging from cropland to wetlands. The Census of Agriculture collects data on different types of land use, comprising the following six categories: cropland, summerfallow, tame or seeded pasture, natural land for pasture, woodlands and wetlands, and all other land.
Wildlife habitat is any land that can be used as a shelter, breeding ground or a food source for wildlife. While most agricultural land provides at least one of these requirements, woodlands and wetlands, and natural land for pasture support more species and rank higher in terms of habitat value.Note 1 When combined, these two categories represent the second largest use of agricultural land in Canada after cropland (Chart 1).
The woodlands and wetlands category includes forests, woodlots, tree windbreaks, hedgerows, ponds, rivers, marshes, bogs, riparian areas and other wetlands. These habitats are used by a variety of wildlife including birds, small and large mammals, fish, amphibians, reptiles and insects. Wetlands remain one of the most important habitat types in the category. They support a large and diverse number of animals, and many species depend on wetlands for all of their shelter, breeding and feeding needs.Note 2
The natural land for pasture category represents pasture land that has not been cultivated, drained, irrigated or fertilized. It includes grasslands and woodlands used for pasture. Grasslands provide habitat to a diversity of wildlife such as small and large mammals, grassland raptors, nesting birds, songbirds and pollinating insects.Note 3
For the purposes of this article, the term “wildlife habitat” will refer to these two agricultural land use categories: woodlands and wetlands, and natural land for pasture as reported in the Census of Agriculture.
Where is wildlife habitat found?
Using data from the Census of Agriculture, wildlife habitat represented 30.2% of all agricultural land in Canada, accounting for 19.6 million hectares in 2011. Looking at individual census divisions,Note 4 wildlife habitat ranged from less than 10% to more than 90% of agricultural land (Map 1). Census divisions with more than 60% of agricultural land considered as wildlife habitat tended to be concentrated in the Atlantic provinces and British Columbia. However, Alberta and Saskatchewan, with 70.0% of agricultural land in Canada, reported the largest wildlife habitat areas at 7.3 million hectares and 5.8 million hectares, respectively.
Map 1
Wildlife habitat on agricultural land, Canada, 2011
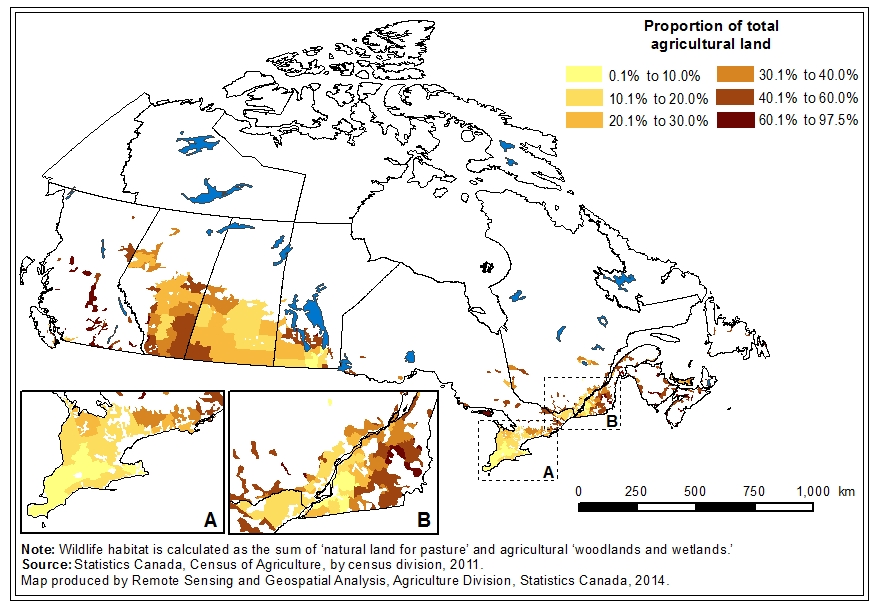
The majority of wildlife habitat reported by Canadian farmers was natural land for pasture, which represented 22.7% of all agricultural land, and the remainder was woodlands and wetlands, which accounted for 7.6% of all agricultural land.
Natural land for pasture is largely found in western Canada (Table 1), with Alberta reporting the most amount of natural pasture area in 2011 (6.4 million hectares), followed by Saskatchewan (4.8 million hectares), Manitoba (1.5 million hectares) and British Columbia (1.4 million hectares). British Columbia reported the largest area of natural land for pasture as a proportion of total agricultural land (53.1%).
| Area of agricultural land | Cropland | Natural land for pasture | Woodlands and wetlands | ||||
|---|---|---|---|---|---|---|---|
| hectares | percent | hectares | percent | hectares | percent | ||
| Canada | 64,812,723 | 35,350,270 | 54.5 | 14,703,330 | 22.7 | 4,897,367 | 7.6 |
| Atlantic provinces | 1,063,343 | 430,363 | 40.5 | 65,711 | 6.2 | 450,031 | 42.3 |
| Quebec | 3,341,333 | 1,874,760 | 56.1 | 134,147 | 4.0 | 1,057,417 | 31.6 |
| Ontario | 5,126,653 | 3,613,821 | 70.5 | 398,538 | 7.8 | 646,578 | 12.6 |
| Manitoba | 7,293,839 | 4,348,869 | 59.6 | 1,466,968 | 20.1 | 549,444 | 7.5 |
| Saskatchewan | 24,940,023 | 14,728,934 | 59.1 | 4,816,782 | 19.3 | 1,009,381 | 4.0 |
| Alberta | 20,436,150 | 9,753,849 | 47.7 | 6,435,825 | 31.5 | 893,436 | 4.4 |
| British Columbia | 2,611,382 | 599,674 | 23.0 | 1,385,359 | 53.1 | 291,079 | 11.1 |
| Source: Statistics Canada, Census of Agriculture, 2011. | |||||||
Woodlands and wetlands represented a larger proportion of agricultural land in eastern Canada. More than 40% of agricultural land in the Atlantic provinces was reported as woodlands and wetlands in 2011. The next largest proportions were in Quebec (31.6 %) and Ontario (12.6%). In terms of total area, however, woodlands and wetlands were spread more evenly across the country (Table 1). Quebec reported the largest area of woodland and wetland in 2011 (1.1 million hectares), followed by Saskatchewan (1.0 million hectares) and Alberta (0.9 million hectares).
What types of farmsNote 5 have wildlife habitat?
The agriculture industry varies widely across Canada, with a diversity of products and farm sizes. This section summarizes the characteristics of farms reporting natural land for pasture, and woodlands and wetlands in the 2011 Census of Agriculture.
Natural land for pasture
Natural land for pasture was reported on 40.3% of all farms in 2011. In general, natural land for pasture was more commonly reported by larger operations and the average area increased with farm size (Table 2).
“Beef cattle” operations had the largest proportion of farms reporting natural land for pasture, followed by “other animal”Note 6 farms, and “sheep and goat” farms (Table 3). “Beef cattle” farms also reported the largest total natural land for pasture in 2011 (10.1 million hectares).
| Farm size (hectares) | All farms |
Farms with natural land for pasture | Natural land for pasture | |||
|---|---|---|---|---|---|---|
| Area | Average area per farm | As a percentage of agricultural land area | ||||
| number | percent | hectares | percent | |||
| All farms | 205,730 | 82,865 | 40.3 | 14,703,330 | 177.4 | 22.7 |
| Under 100 | 105,169 | 33,915 | 32.2 | 470,698 | 13.9 | 12.0 |
| 100 to 199 | 34,182 | 14,408 | 42.2 | 625,001 | 43.4 | 12.6 |
| 200 to 299 | 15,226 | 6,985 | 45.9 | 518,719 | 74.3 | 13.8 |
| 300 to 399 | 10,730 | 5,290 | 49.3 | 558,330 | 105.5 | 14.9 |
| 400 to 499 | 6,650 | 3,348 | 50.3 | 455,551 | 136.1 | 15.3 |
| 500 to 749 | 11,918 | 6,324 | 53.1 | 1,209,269 | 191.2 | 16.6 |
| 750 to 999 | 7,075 | 3,838 | 54.2 | 1,033,186 | 269.2 | 16.9 |
| 1,000 to 1,999 | 10,145 | 5,742 | 56.6 | 2,678,327 | 466.4 | 19.4 |
| 2,000 or more | 4,635 | 3,015 | 65.0 | 7,154,249 | 2,372.9 | 39.2 |
| Source: Statistics Canada, Census of Agriculture, 2011. | ||||||
| Farm type (by NAICS) | All farms |
Farms with natural land for pasture | Natural land for pasture | |||
|---|---|---|---|---|---|---|
| Area | Average area per farm | As a percentage of agricultural land area | ||||
| number | percent | hectares | percent | |||
| All farms | 205,730 | 82,865 | 40.3 | 14,703,330 | 177.4 | 22.7 |
| Dairy cattle and milk production | 12,207 | 4,104 | 33.6 | 108,162 | 26.4 | 5.0 |
| Beef cattle ranching and farming, including feedlots | 37,406 | 26,426 | 70.6 | 10,072,656 | 381.2 | 52.8 |
| Hog and pig farming | 3,470 | 620 | 17.9 | 31,730 | 51.2 | 5.0 |
| Poultry and egg production | 4,484 | 976 | 21.8 | 12,774 | 13.1 | 5.5 |
| Sheep and goat farming | 3,924 | 1,913 | 48.8 | 35,468 | 18.5 | 17.1 |
| Other animal production | 24,124 | 13,814 | 57.3 | 920,898 | 66.7 | 29.7 |
| Oilseed and grain farming | 61,692 | 16,644 | 27.0 | 2,119,863 | 127.4 | 6.7 |
| Vegetable and melon farming | 4,822 | 843 | 17.5 | 19,711 | 23.4 | 2.9 |
| Fruit and tree nut farming | 8,253 | 1,123 | 13.6 | 11,360 | 10.1 | 3.3 |
| Greenhouse, nursery and floriculture production | 7,946 | 1,168 | 14.7 | 20,388 | 17.5 | 7.4 |
| Other crop farming | 37,402 | 15,234 | 40.7 | 1,350,319 | 88.6 | 20.9 |
| Source: Statistics Canada, Census of Agriculture, 2011. | ||||||
Woodlands and wetlands
Approximately half of all farms (49.9%) reported woodlands and wetlands in 2011. In contrast to natural land for pasture, woodlands and wetlands were more commonly reported on small to mid-sized operations (Table 4). However, the average woodlands and wetlands area for a farm in a particular size category increased with farm size.
Woodlands and wetlands were most commonly reported on “dairy cattle” farms, followed by “other crop”Note 7 farms and “hog and pig” farms (Table 5). “Oilseed and grain” farms, the most common farm type in 2011 representing 3 in 10 of all farm operations, also accounted for the largest area of woodlands and wetlands (1.5 million hectares).
| Farm size (hectares) | All farms |
Farms with woodlands and wetlands | Woodlands and wetlands | |||
|---|---|---|---|---|---|---|
| Area | Average area per farm | As a percentage of agricultural land area | ||||
| number | percent | hectares | percent | |||
| All farms | 205,730 | 102,744 | 49.9 | 4,897,367 | 47.7 | 7.6 |
| Under 100 | 105,169 | 50,058 | 47.6 | 722,610 | 14.4 | 18.4 |
| 100 to 199 | 34,182 | 19,864 | 58.1 | 765,816 | 38.6 | 15.5 |
| 200 to 299 | 15,226 | 8,552 | 56.2 | 509,738 | 59.6 | 13.5 |
| 300 to 399 | 10,730 | 5,684 | 53.0 | 393,563 | 69.2 | 10.5 |
| 400 to 499 | 6,650 | 3,305 | 49.7 | 272,839 | 82.6 | 9.2 |
| 500 to 749 | 11,918 | 5,797 | 48.6 | 517,592 | 89.3 | 7.1 |
| 750 to 999 | 7,075 | 3,262 | 46.1 | 369,410 | 113.2 | 6.1 |
| 1,000 to 1,999 | 10,145 | 4,547 | 44.8 | 692,727 | 152.3 | 5.0 |
| 2,000 or more | 4,635 | 1,675 | 36.1 | 653,073 | 389.9 | 3.6 |
| Source: Statistics Canada, Census of Agriculture, 2011. | ||||||
| Farm type (by NAICS) | All farms |
Farms with woodlands and wetlands | Woodlands and wetlands | |||
|---|---|---|---|---|---|---|
| Area | Average area per farm | As a percentage of agricultural land area | ||||
| number | percent | hectares | percent | |||
| All farms | 205,730 | 102,744 | 49.9 | 4,897,367 | 47.7 | 7.6 |
| Dairy cattle and milk production | 12,207 | 8,513 | 69.7 | 362,675 | 42.6 | 16.9 |
| Beef cattle ranching and farming including feedlots | 37,406 | 17,133 | 45.8 | 1,133,451 | 66.2 | 5.9 |
| Hog and pig farming | 3,470 | 1,909 | 55.0 | 66,956 | 35.1 | 10.5 |
| Poultry and egg production | 4,484 | 1,789 | 39.9 | 36,634 | 20.5 | 15.8 |
| Sheep and goat farming | 3,924 | 2,002 | 51.0 | 48,670 | 24.3 | 23.5 |
| Other animal production | 24,124 | 10,940 | 45.3 | 310,442 | 28.4 | 10.0 |
| Oilseed and grain farming | 61,692 | 28,963 | 46.9 | 1,483,879 | 51.2 | 4.7 |
| Vegetable and melon farming | 4,822 | 2,410 | 50.0 | 96,694 | 40.1 | 14.4 |
| Fruit and tree nut farming | 8,253 | 3,587 | 43.5 | 165,263 | 46.1 | 47.5 |
| Greenhouse, nursery and floriculture production | 7,946 | 3,361 | 42.3 | 102,728 | 30.6 | 37.1 |
| Other crop farming | 37,402 | 22,137 | 59.2 | 1,089,974 | 49.2 | 16.9 |
| Source: Statistics Canada, Census of Agriculture, 2011. | ||||||
How do farmers benefit from wildlife?
Wildlife provides many benefits to farmers that are not always obvious. These “ecosystem services” include crop pollination, breakdown of organic matter to provide nutrients for crops, contaminant degradation and agricultural pest control. For example, a member of the little brown bat species can eat 600 mosquitoes in an hour,Note 8 a breeding pair of ferruginous hawks can effectively control gophers,Note 9 and lady beetles are important predators of numerous agricultural pests including soybean aphids.Note 10
Agricultural dependence on pollinators
One of the valuable ecosystem services that wildlife provides to agriculture is pollination. While some food crops grown in Canada require insect pollinators to produce a crop or to achieve maximum yields, for other crops, pollinators have little effect on crop production.Note 11
The majority of the fruits, and certain vegetables and field crops reported in the Census of Agriculture, depend on pollinators for pollination. For fruits and vegetables alone, pollinators are required for maximum production of 14 food crops,Note 12 which totalled 119,418 hectares in 2011 (Chart 2).
Pollinators are also required for successful crops of buckwheat, sunflowers, mustard seed and caraway seed, and can increase the yields for some canola crops, as well as certain varieties of soybeans and dry beans.
In total, there were 9.8 million hectares of crops in Canada that benefited from pollinators, accounting for 27.8% of total cropland area and 35.9% of all farms in 2011. Of this, 0.3 million hectares were crops that depend on pollinators for pollination (Table 6).
| Crop | Area |
|---|---|
| hectares | |
| Apples | 18,243 |
| Pears | 944 |
| Plums and prunes | 684 |
| Cherries (sweet) | 1,951 |
| Cherries (sour) | 1,147 |
| Peaches | 3,154 |
| Apricots | 136 |
| Strawberries | 4,486 |
| Raspberries | 2,998 |
| Cranberries | 6,148 |
| Blueberries | 70,852 |
| Cucumbers | 2,339 |
| Pumpkins | 3,441 |
| Squash and zucchini | 2,895 |
| Mustard seed | 120,127 |
| Sunflowers | 31,480 |
| Buckwheat | 13,558 |
| Caraway seed | 5,209 |
| Crops dependant on pollinators | 289,792 |
| Canola | 7,838,354 |
| Soybeans | 1,601,653 |
| Dry white beans | 37,522 |
| Other dry beans | 60,174 |
| Crops enhanced by pollinators | 9,537,703 |
| All crops that benefit from pollinators | 9,827,495 |
| Source: Statistics Canada, Census of Agriculture, 2011. | |
The presence of wild pollinators and wildlife habitat has economic advantages for farmers. Some farms rely fully on wild pollinators, such as solitary bees, bumble bees, other wild bees, wasps and flies for pollination, while other farms bring in additional pollinators to achieve adequate pollination.Note 13
For many crops that benefit from pollinators, production is positively related to the availability of wild pollinator habitat. Wildlife habitat in the surrounding area can enhance pollination by wild pollinators and thereby increase yields.Note 14,Note 15 In Canada, wildlife habitat is present on 65% of the farms that benefit from pollinators.
What farm practices benefit wildlife?
There are several agricultural practices that enhance wildlife habitat. Examples include rotational grazing, windbreaks, winter cover crops, buffer zones around water bodies, and tillage practices that retain most of the crop residue on the surface. These practices are mutually beneficial to both the farm and wildlife.
Hedgerows and tree windbreaks
Hedgerows, fencerows and windbreaks can provide shelter, food and breeding sites to many wildlife species. They can also serve as valuable travel corridors that allow animals to move between habitats. For farmers, the advantages of these agricultural features and the wildlife they support include pollination, reduced soil erosion and natural agricultural pest control. In 2011, windbreaks or shelterbelts were reported on 29.7% of all farms, down from 36.9% in 2006.
Tillage
Crop residue are materials, such as straw, stalks and stubble, that are left on a field or orchard after a crop has been harvested. The amount of crop residue that remains on the surface after harvesting depends on the type of tillage used to prepare the soil for the next crop.
Conventional tillage incorporates most of the crop residue into the soil, whereas conservation tillage and no-till retain most of the crop residue on the surface. Several wildlife species find refuge, feed and nest in crop residue, therefore these species benefit from no-till and properly timed conservation tillage.Note 16 From the perspective of the farmer, no-till and conservation tillage can reduce soil erosion, increase soil organic matter and help retain soil moisture. One of the negative aspects of no-till seeding is that farmers will typically rely more heavily on pesticides to control weeds and insects.
The total area of agricultural land prepared for seeding has remained relatively constant over the past two decades, rising slightly from 29.0 million hectares in 1991 to 29.6 million hectares in 2011. However, the methods used to till the soil have shifted (Chart 3). Conventional tillage is no longer the most common method used by Canadian farmers and, in 2011, it represented under 20% of all land prepared for seeding. It has been surpassed by conservation tillage (24.6%) and no-till seeding (56.4%) as the most common methods of tillage.
Grazing
Farms use both natural and tame pasture land for livestock grazing. Both types of pasture are also used by wildlife, although natural pasture is considered more valuable as both feeding and breeding habitat. Grasslands, in particular, provide habitat for a large diversity of wildlife, including many grassland birds that benefit from well-managed livestock grazing.Note 17
For pasture land in general, wildlife habitat and the quality of livestock forage can be improved by implementing rotational grazing. Rotational grazing involves alternating use of two or more pastures at regular intervals, or temporary fences within pastures to prevent overgrazing. This allows pastures sufficient time to recover and improves soil and plant health. In 2011, 49.4% of all farms with cattle and pasture land reported practising rotational grazing, down from 54.4% in 2006.
Buffer zones
Buffer zones are strips of land around water bodies including streams, rivers and wetlands. They prevent sediments and contaminants from entering water bodies, provide wildlife habitat, and act as travel corridors between habitats. This, in turn, improves water quality for livestock use and protects fish stocks for recreational use. In 2011, buffer zones were reported on 20.7% of all Canadian farms, up from 19.6% in 2006.
Conserving natural pasture, woodlands and wetlands
Conserving natural pasture, woodlands and wetlands in the agricultural landscape is an important step to maintaining these valuable habitats. Recent challenges faced by Canadian farmers coupled with increases in cash crop prices have made this a difficult task. Stewardship programs, such as community pastures, have played an important role in maintaining natural pasture land in Canada.Note 18,Note 19 For example, 468 community pastures reported over 2.4 million hectares of natural pasture on the 2011 Census of Agriculture. Overall, however, there was a 4.8% decrease in natural pasture land between 2006 and 2011.
Woodlands and wetlands reported in the Census of Agriculture also decreased between 2006 and 2011. Across Canada there was an 8.8% decline in woodlands and wetlands area on agricultural land, amounting to a decrease of approximately 0.5 million hectares.
With important wildlife habitat representing 30% of all agricultural land reported in the Census of Agriculture, and wildlife providing invaluable ecosystem services, the relationship between agriculture and wildlife might be described as co-dependent.
Producers are increasingly being recognized as stewards of biodiversity. Through conservation and proper management of the agricultural landscape, this relationship can continue to be beneficial to both producers and wildlife.
Notes
- Date modified: