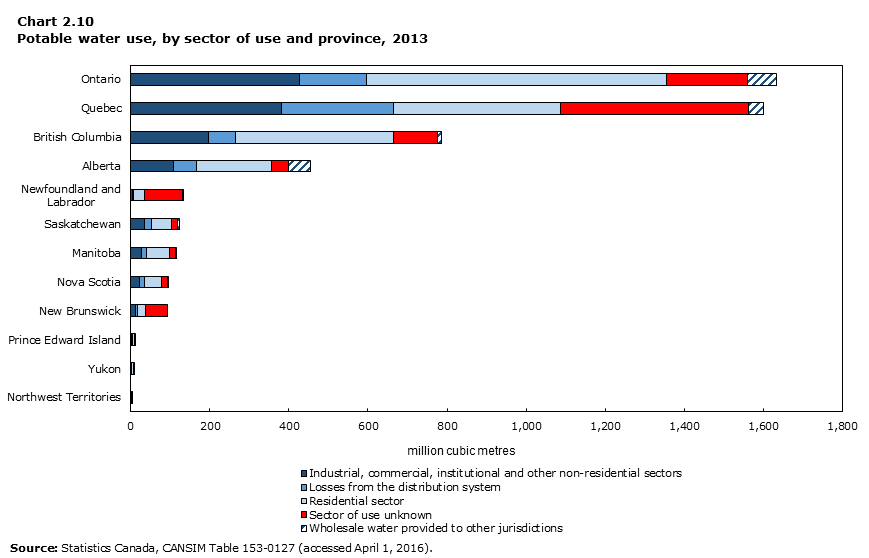
Chart 2.10 Potable water use, by sector of use and province, 2013
Chart 2.10 Potable water use, by sector of use and province, 2013
Data table for Chart 2.10
Data table for Chart 2.10
Table summary
This table displays the results of Data table for Chart 2.10 Industrial, commercial, institutional and other non-residential sectors , Losses from the distribution system , Residential sector, Sector of use unknown and Wholesale water provided to other jurisdictions, calculated using million cubic metres units of measure (appearing as column headers).
Industrial, commercial, institutional and other non-residential sectors
Losses from the distribution system
Residential sector
Sector of use unknown
Wholesale water provided to other jurisdictions
million cubic metres
Nunavut
0.4
0.1
1.8
0.2
0.0
Northwest Territories
0.3
0.0
1.3
3.9
0.0
Yukon
1.9
0.4
4.6
1.1
0.0
Prince Edward Island
2.8
1.0
4.8
3.5
0.0
New Brunswick
10.9
5.1
20.5
56.3
0.0
Nova Scotia
21.2
14.7
41.4
15.7
1.1
Manitoba
27.2
13.7
56.3
14.8
3.5
Saskatchewan
34.7
17.6
51.6
13.3
5.0
Newfoundland and Labrador
5.5
2.2
28.1
94.6
0.3
Alberta
108.2
57.7
191.0
42.4
56.5
British Columbia
195.5
70.7
397.2
111.5
11.3
Quebec
382.5
281.6
422.4
476.2
36.8
Ontario
426.1
171.4
756.4
205.2
75.0
Canada
1,217.2
636.3
1,977.5
1,038.9
189.5
Source: Statistics Canada, CANSIM Table 153-0127 (accessed April 1, 2016).