
Map 2.7
Population size and variation of 2016 forest sector-based communities, 2001 to 2016
Description for Map 2.7
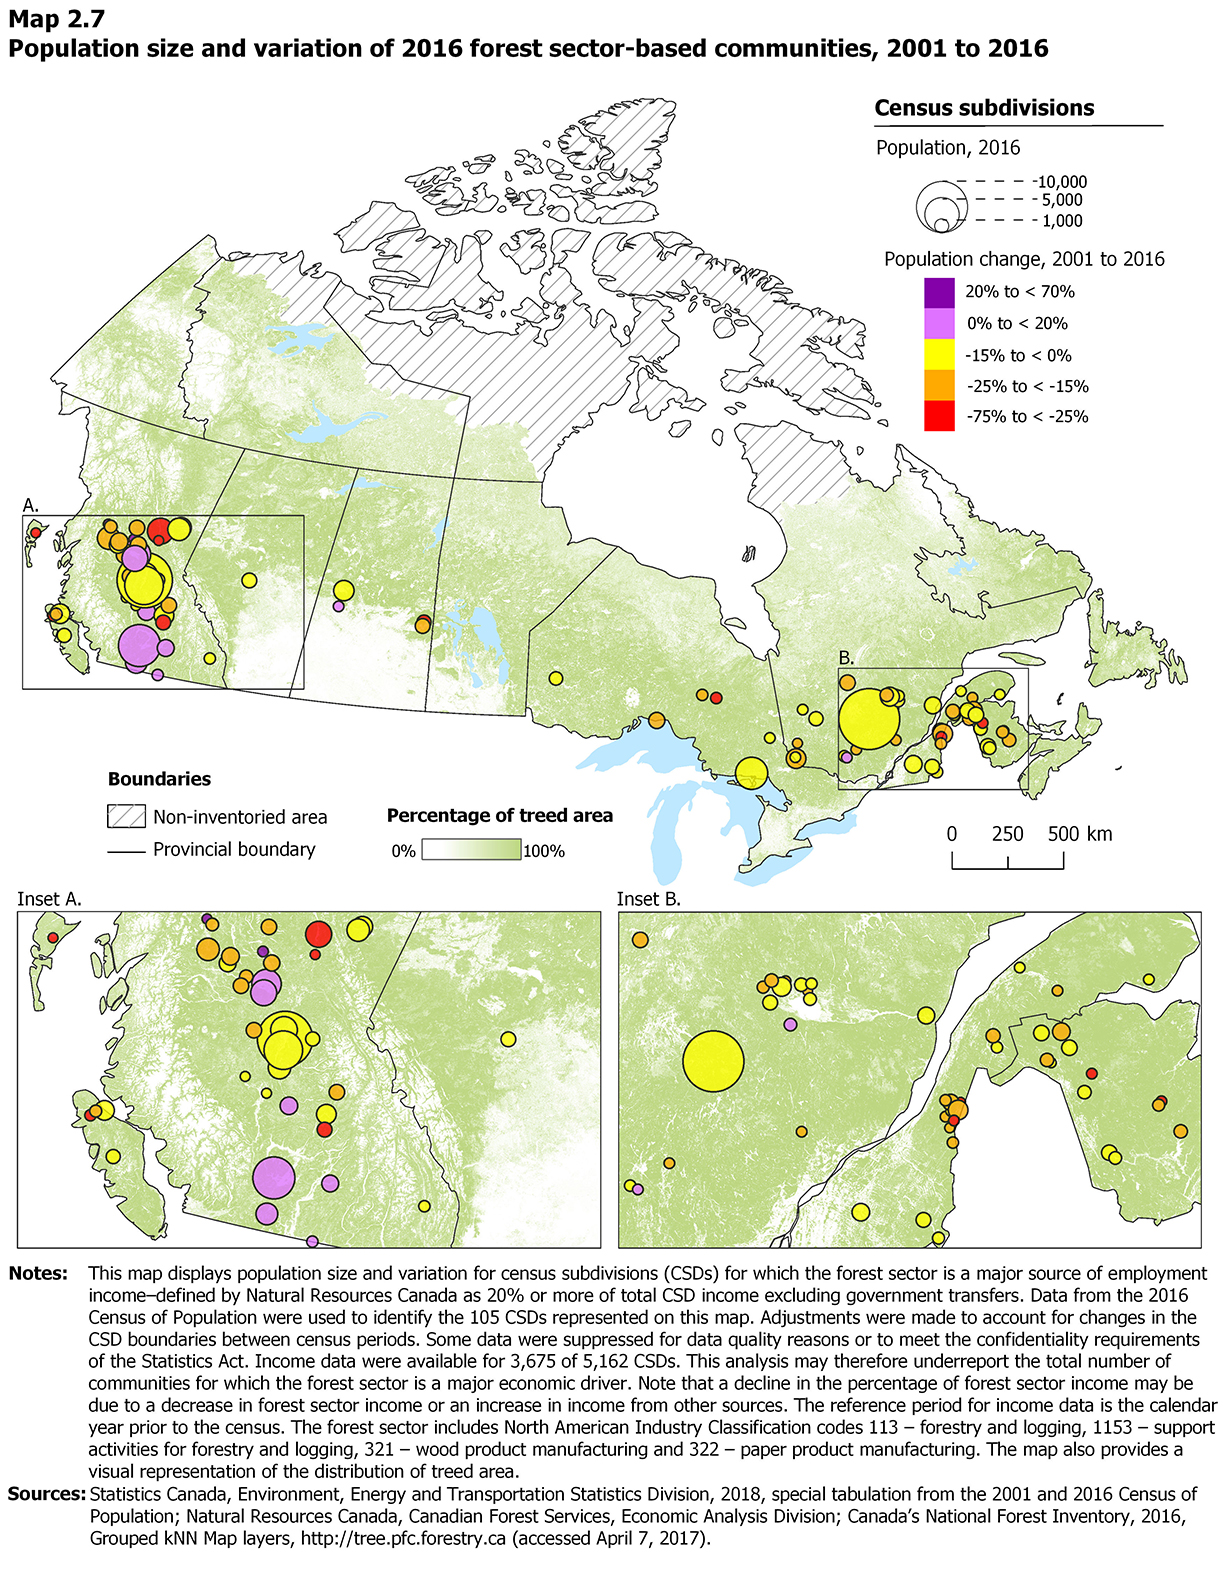
The title of this map is "Population size and variation of 2016 forest sector-based communities, 2001 to 2016." This map displays the size and location of census subdivisions (CSDs) for which the forest sector is a major source of income, as well as the percentage of treed area.
On this map, the 2016 population of CSDs for which the forest sector is a major source of income is indicated by a proportionately-sized circle. Larger circles proportionally represent larger CSD populations, while smaller circles represent smaller CSD populations. The legend displays 3 circles for reference: the large circle indicates CSDs with a population of 10,000, the medium circle indicates CSDs with a population of 5,000 and the small circle indicates CSDs with a population of 1,000. Population change from 2001 to 2016 is indicated with colors: red (-75% to < -25%); orange (-25% to < -15%); yellow (-15% to < 0%); purple (0% to < 20%) and dark purple (20% to < 70%).
The level of green shading represents the percentage of treed area. The colour ranges on a scale from white (0%) through light green (50%) to green (100%). Non-inventoried ecozones are indicated in white with grey diagonal lines—there is no data for these areas.
A solid black line defines provincial boundaries. Water is pale blue.
Communities for which the forest sector was a major source of income in 2016 are mainly clustered in two regions: eastern Canada (particularly in Quebec and New Brunswick) and western Canada (particularly in the Interior of British Columbia). In general, the population of these communities declined from 2001 to 2016.
The highest percentages of treed area occur in the Atlantic Maritime, Boreal Shield and Montane Cordillera ecozones. Ecozones with the lowest percentages of treed area include the Prairies, Mixedwood Plains and Taiga Cordillera.
Notes: This map displays population size and variation for census subdivisions (CSDs) for which the forest sector is a major source of employment income–defined by Natural Resources Canada as 20% or more of total CSD income excluding government transfers. Data from the 2016 Census of Population were used to identify the 105 CSDs represented on this map. Adjustments were made to account for changes in the CSD boundaries between census periods. Some data were suppressed for data quality reasons or to meet the confidentiality requirements of the Statistics Act. Income data were available for 3,675 of 5,162 CSDs. This analysis may therefore underreport the total number of communities for which the forest sector is a major economic driver. Note that a decline in the percentage of forest sector income may be due to a decrease in forest sector income or an increase in income from other sources. The reference period for income data is the calendar year prior to the census. The forest sector includes North American Industry Classification codes 113 – forestry and logging, 1153 – support activities for forestry and logging, 321 – wood product manufacturing and 322 – paper product manufacturing. The map also provides a visual representation of the distribution of treed area.
Sources: Statistics Canada, Environment, Energy and Transportation Statistics Division, 2018, special tabulation from the 2001 and 2016 Census of Population; Natural Resources Canada, Canadian Forest Services, Economic Analysis Division; Canada's National Forest Inventory, 2016, Grouped kNN Map layers, http://tree.pfc.forestry.ca (accessed April 7, 2017).
| Category | Population, 2016 | Size |
|---|---|---|
| 1 | 10,000 | Large circle |
| 2 | 5,000 | Medium circle |
| 3 | 1,000 | Small circle |
| Category | Population change, 2001 to 2016 | Colour |
| 4 | 20% to < 70% | Dark purple |
| 5 | 0% to < 20% | Purple |
| 6 | -15% to < 0% | Yellow |
| 7 | -25% to < -15% | Orange |
| 8 | -75% to < -25% | Red |
| Province | Census subdivisions | Population | ||
|---|---|---|---|---|
| 2001 | 2016 | Change from 2001 to 2016 | ||
| number | percent | |||
| Total | 105 | 177,459 | 159,420 | -10.2 |
| New Brunswick | 12 | 15,262 | 13,203 | -13.5 |
| Quebec | 40 | 51,382 | 45,096 | -12.2 |
| Ontario | 7 | 11,252 | 9,880 | -12.2 |
| Saskatchewan | 4 | 6,401 | 5,399 | -15.7 |
| Alberta | 1 | 1,459 | 1,320 | -9.5 |
| British Columbia | 41 | 91,702 | 84,522 | -7.8 |
| Census subdivision | Province | Population | ||
|---|---|---|---|---|
| 2001 | 2016 | Change 2001 to 2016 | ||
| number | percent | |||
| Chipman | New Brunswick | 1,392 | 1,104 | -20.7 |
| Blissfield | New Brunswick | 639 | 451 | -29.5 |
| Doaktown | New Brunswick | 952 | 792 | -16.8 |
| Southampton | New Brunswick | 1,741 | 1,484 | -14.7 |
| Nackawic | New Brunswick | 1,042 | 941 | -9.7 |
| Plaster Rock | New Brunswick | 1,189 | 1,023 | -13.9 |
| Lorne | New Brunswick | 623 | 464 | -25.5 |
| Notre-Dame-de-Lourdes | New Brunswick | 308 | 275 | -10.7 |
| Sainte-Anne | New Brunswick | 1,193 | 964 | -19.2 |
| Kedgwick | New Brunswick | 2,348 | 1,979 | -15.7 |
| Saint-Quentin | New Brunswick | 1,580 | 1,532 | -3.0 |
| Saint-Quentin | New Brunswick | 2,256 | 2,194 | -2.8 |
| Albanel | Quebec | 2,447 | 2,262 | -7.6 |
| Belleterre | Quebec | 381 | 313 | -17.9 |
| Bois-Franc | Quebec | 401 | 421 | 4.9 |
| Chapais | Quebec | 1,795 | 1,499 | -16.5 |
| Girardville | Quebec | 1,284 | 988 | -23.1 |
| Kebaowek | Quebec | 233 | 274 | 17.4 |
| Kingsey Falls | Quebec | 2,023 | 1,947 | -3.7 |
| Kipawa | Quebec | 528 | 516 | -2.2 |
| La Doré | Quebec | 1,554 | 1,365 | -12.2 |
| La Tuque | Quebec | 12,485 | 11,001 | -11.9 |
| Montcerf-Lytton | Quebec | 734 | 636 | -13.3 |
| Mont-Saint-Michel | Quebec | 618 | 503 | -18.6 |
| Nantes | Quebec | 1,409 | 1,377 | -2.3 |
| Sacré-Coeur | Quebec | 2,053 | 1,803 | -12.2 |
| Saint-Adalbert | Quebec | 688 | 510 | -25.8 |
| Saint-Augustin | Quebec | 422 | 351 | -16.9 |
| Saint-Augustin-de-Woburn | Quebec | 722 | 692 | -4.2 |
| Saint-Damase | Quebec | 448 | 426 | -4.9 |
| Saint-Dominique-du-Rosaire | Quebec | 463 | 450 | -2.8 |
| Sainte-Félicité | Quebec | 452 | 389 | -14.0 |
| Sainte-Florence | Quebec | 475 | 384 | -19.2 |
| Sainte-Hedwidge | Quebec | 844 | 846 | 0.3 |
| Sainte-Jeanne-d'Arc | Quebec | 1,125 | 1,050 | -6.7 |
| Sainte-Lucie-de-Beauregard | Quebec | 353 | 280 | -20.6 |
| Saint-Elzéar | Quebec | 508 | 458 | -9.9 |
| Sainte-Monique | Quebec | 930 | 846 | -9.0 |
| Sainte-Perpétue | Quebec | 1,989 | 1,639 | -17.6 |
| Saint-Eugène-d'Argentenay | Quebec | 609 | 488 | -19.8 |
| Saint-Just-de-Bretenières | Quebec | 827 | 668 | -19.2 |
| Saint-Juste-du-Lac | Quebec | 653 | 561 | -14.1 |
| Saint-Ludger-de-Milot | Quebec | 764 | 651 | -14.8 |
| Saint-Marcel | Quebec | 531 | 428 | -19.4 |
| Saint-Michel-du-Squatec | Quebec | 1,331 | 1,113 | -16.4 |
| Saint-Omer | Quebec | 380 | 277 | -27.0 |
| Saint-Pamphile | Quebec | 2,849 | 2,400 | -15.7 |
| Saint-Thomas-Didyme | Quebec | 796 | 676 | -15.1 |
| Senneterre | Quebec | 1,195 | 1,192 | -0.2 |
| Témiscaming | Quebec | 2,904 | 2,431 | -16.3 |
| Tourville | Quebec | 709 | 589 | -17.0 |
| Trois-Rives | Quebec | 470 | 396 | -15.7 |
| Baldwin | Ontario | 622 | 620 | -0.3 |
| Constance Lake 92 | Ontario | 721 | 590 | -18.2 |
| Ear Falls | Ontario | 1,150 | 995 | -13.5 |
| Espanola | Ontario | 5,451 | 4,996 | -8.3 |
| James | Ontario | 466 | 420 | -9.9 |
| Mattice-Val Côté | Ontario | 891 | 648 | -27.3 |
| Terrace Bay | Ontario | 1,951 | 1,611 | -17.4 |
| Hudson Bay No. 394 | Saskatchewan | 1,492 | 1,114 | -25.3 |
| Hudson Bay | Saskatchewan | 1,783 | 1,397 | -21.6 |
| Glaslyn | Saskatchewan | 375 | 387 | 3.2 |
| Meadow Lake No. 588 | Saskatchewan | 2,751 | 2,501 | -9.1 |
| Mayerthorpe | Alberta | 1,459 | 1,320 | -9.5 |
| Alkali Lake 1 | British Columbia | 369 | 328 | -11.1 |
| Anahim's Flat 1 | British Columbia | 378 | 342 | -9.6 |
| Bulkley-Nechako B | British Columbia | 2,332 | 1,938 | -16.9 |
| Bulkley-Nechako C | British Columbia | 1,715 | 1,415 | -17.5 |
| Bulkley-Nechako D | British Columbia | 1,752 | 1,472 | -16.0 |
| Bulkley-Nechako F | British Columbia | 3,412 | 3,665 | 7.4 |
| Bulkley-Nechako G | British Columbia | 1,162 | 903 | -22.3 |
| Burns Lake | British Columbia | 1,948 | 1,779 | -8.7 |
| Canal Flats | British Columbia | 732 | 668 | -8.7 |
| Cariboo A | British Columbia | 6,411 | 6,265 | -2.3 |
| Cariboo B | British Columbia | 4,357 | 3,842 | -11.8 |
| Cariboo C | British Columbia | 1,318 | 1,225 | -7.0 |
| Cariboo D | British Columbia | 3,335 | 2,929 | -12.2 |
| Cariboo I | British Columbia | 1,842 | 1,440 | -21.8 |
| Chetwynd | British Columbia | 2,521 | 2,503 | -0.7 |
| Clearwater | British Columbia | 2,447 | 2,324 | -5.0 |
| Fort St. James | British Columbia | 1,961 | 1,598 | -18.5 |
| Fraser Lake | British Columbia | 1,257 | 988 | -21.4 |
| Fraser-Fort George G | British Columbia | 488 | 334 | -31.6 |
| Gold River | British Columbia | 1,350 | 1,212 | -10.2 |
| Houston | British Columbia | 3,572 | 2,993 | -16.2 |
| Lumby | British Columbia | 1,615 | 1,833 | 13.5 |
| Mackenzie | British Columbia | 5,203 | 3,714 | -28.6 |
| Merritt | British Columbia | 7,067 | 7,139 | 1.0 |
| Midway | British Columbia | 638 | 649 | 1.7 |
| Moricetown 1 | British Columbia | 190 | 306 | 61.3 |
| Mount Waddington C | British Columbia | 963 | 750 | -22.1 |
| Nak'azdli (Necoslie 1) | British Columbia | 451 | 548 | 21.4 |
| Nicola Mameet 1 | British Columbia | 320 | 532 | 66.4 |
| One Hundred Mile House | British Columbia | 1,750 | 1,980 | 13.2 |
| Peace River E | British Columbia | 3,225 | 2,949 | -8.6 |
| Port Alice | British Columbia | 994 | 664 | -33.2 |
| Port Clements | British Columbia | 457 | 282 | -38.3 |
| Port McNeill | British Columbia | 2,687 | 2,337 | -13.0 |
| Princeton | British Columbia | 2,628 | 2,828 | 7.6 |
| Quesnel | British Columbia | 10,032 | 9,879 | -1.5 |
| Stony Creek 1 | British Columbia | 410 | 313 | -23.6 |
| Tache 1 | British Columbia | 307 | 401 | 30.7 |
| Thompson-Nicola A (Wells Gray Country) | British Columbia | 1,949 | 1,493 | -23.4 |
| Thompson-Nicola O (Lower North Thompson) | British Columbia | 1,788 | 1,323 | -26.0 |
| Vanderhoof | British Columbia | 4,368 | 4,439 | 1.6 |
Download spatial data files for Map 2.7
Download spatial data files (ArcGIS®, file extension: .shp) for Map 2.7
This product provides population counts for 2001 and 2016 for 105 census subdivisions (CSDs) for which the forest sector is a major source of employment income—defined by Natural Resources Canada as 20% or more of total CSD income excluding government transfers.
These files were produced by Statistics Canada, Environment, Energy and Transportation Statistics Division, 2018, special tabulation from the 2001 and 2016 Census of Population; Natural Resources Canada, Canadian Forest Services, Economic Analysis Division; Canada's National Forest Inventory (NFI), 2016, Grouped kNN Map layers, http://tree.pfc.forestry.ca (accessed April 7, 2017).
Data from the 2016 Census of Population were used to identify the 105 census subdivisions. Note that changes occur to the number and the boundaries of CSDs between censuses. Adjustments were made to CSD boundaries to account for changes.
Some data were suppressed for data quality reasons or to meet the confidentiality requirements of the Statistics Act. Income data were available for 3,675 of 5,162 CSDs. This analysis may therefore underreport the total number of communities for which the forest sector is a major economic driver.
Note that a decline in the percentage of forest sector income may be due to a decrease in forest sector income or an increase in income from other sources. The reference period for income data in the Census of Population is the calendar year prior to the census.
The forest sector includes North American Industry Classification codes 113 – forestry and logging, 1153 – support activities for forestry and logging, 321 – wood product manufacturing and 322 – paper product manufacturing.
These files will also be accessible as web services on the Government of Canada web site Open Maps.
Time Period From: 2001 - To: 2016
Spatial Reference System
Type: Lambert Conformal Conic
Projection Reference
WKID: 3978 Authority: EPSG
false_easting: 0.0
false_northing: 0.0
central_meridian: -95.0
standard_parallel_1: 49.0
standard_parallel_2: 77.0
latitude_of_origin: 49.0
Linear Unit: Meter (1.0)
Coordinate Reference Details
Angular Unit: Degree (0.0174532925199433)
Prime Meridian: Greenwich (0.0)
Datum: D_North_American_1983
Spheroid: GRS_1980
Semimajor Axis: 6378137.0
Semiminor Axis: 6356752.314140356
Inverse Flattening: 298.257222101
| Field | Description |
|---|---|
| CSDUID | Census subdivision unique identifier |
| CSDNAME | Census subdivision name |
| CSDTYPE | Census subdivision type |
| PRUID | Province unique identifier |
| PRNAME | Province name |
| PERPOPCHG | Percent population change between 2001 and 2016 |
| 2001POPADJ | 2001 population adjusted to the 2016 boundaries |
| 2016POP | 2016 population |
Additional Information
Dataset Identification
Date: 12/2017(Creation)
Date: 03/2018 (Publication)
Metadata language: English (Other language: French)
Character set: UTF8
Status: Completed
Maintenance and update frequency: As needed
Spatial representation type: Vector
Use Limitation Open Government Licence – Canada (http://open.canada.ca/en/open- government-licence-canada)
Access Constraints: License
Use Constraints: License
- Date modified: