
Publications
The Canadian Labour Market at a Glance
Hourly wages and Consumer Price Index

Archived Content
Information identified as archived is provided for reference, research or recordkeeping purposes. It is not subject to the Government of Canada Web Standards and has not been altered or updated since it was archived. Please "contact us" to request a format other than those available.
Wages adjusted for inflation rose for the fourth consecutive year
-
In 2007, Canadian employees earned an average of $20.41 per hour before taxes and other deductions, 3.5% more than the year before. During that period, the Consumer Price Index (CPI) increased 2.2%, so the real average hourly wage, adjusted for inflation, was 1.3% higher than in 2006. After the real average hourly wage, adjusted for inflation, declined 0.6% from 2002 to 2003, the average hourly wage (in current dollars) rose faster than the CPI.
-
Men's hourly wages have traditionally been higher than women's. In 2007, women earned an average of 84 cents for every dollar earned by men. This wage gap remained fairly stable from 2005 to 2007, with the exception of the youth aged 15 to 24, where average hourly wage did not rise as fast for women as it did for men. Despite everything, that age group had the smallest difference in wages between the sexes. Also, the greater the age, the wider the gap in average hourly wages became.
-
Alberta's strong economy has had a positive impact on its average hourly wages, which rose 6.1% in 2007, or 3.8%, if adjusted for inflation. Since 2006, Alberta has had the highest hourly wage in Canada, higher than Ontario. However, the gain was eroded by the soaring cost of living, as the province's CPI increased, the largest increase in the country. Nova Scotia and Newfoundland and Labrador also fared particularly well, with increases of 3.0% and 2.9% in real hourly wages, respectively. Their average hourly wages, $17.35 and $17.46, nevertheless remained below the national average. In Newfoundland and Labrador, which enjoyed the third-largest gain in average hourly wages and the smallest rise in the cost of living (+1.5%), the net result was an increase in purchasing power.
Chart J.1
Annual percentage change in average
hourly wages (current dollars) and in the
Consumer Price Index
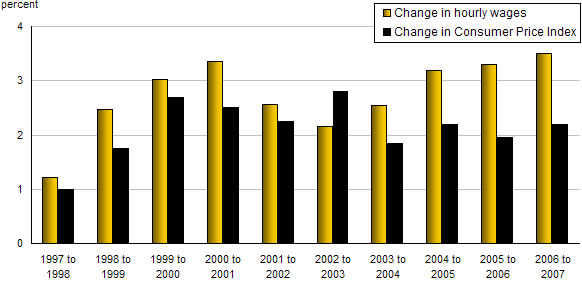
Sources: Statistics Canada, Labour Force Survey, and Consumer Price Index, CANSIM tables 282-0070 and 326-0021.
- Date modified: