
Demographic data visualization products
More informationAnnual demographic estimates, census metropolitan areas and census agglomerations: Interactive dashboard

This interactive dashboard allows the user to visualize the factors of population growth and how they have changed over time for census metropolitan areas and census agglomerations. The dashboard shows population, population growth, factors of population growth (natural increase, international migration, interprovincial migration, intraprovincial migration), and the proportion of the population by age group. The user can view the data by selecting a census metropolitan area or a census agglomeration of interest as well as a year of interest.
Annual demographic estimates, census divisions: Interactive dashboard

This interactive dashboard can be used to visualize the factors of population growth and how they have changed over time for census divisions. The dashboard shows population, population growth, factors of population growth (natural increase, international migration, interprovincial migration, intraprovincial migration), and the proportion of the population by age group. The user can view the data by selecting a census division of interest as well as a year of interest.
Annual demographic estimates, economic regions: Interactive dashboard

This interactive dashboard can be used to visualize the factors of population growth and how they have changed over time for economic regions. The dashboard shows population, population growth, factors of population growth (natural increase, international migration, interprovincial migration, intraprovincial migration), and the proportion of the population by age group. The user can view the data by selecting an economic region of interest as well as a year of interest.
Annual demographic estimates, rural and urban areas: Interactive dashboard

This interactive dashboard can be used to visualize the factors of population growth and how they have changed over time for rural and urban areas. The dashboard shows population, population growth, factors of population growth (natural increase, international migration, interprovincial migration, intraprovincial migration), and the proportion of the population by age group. Users can view the data by province or territory, as well as by year, age group, and rural or urban area.
Demographic estimates by age and gender, provinces and territories: Interactive dashboard

This interactive dashboard allows the visualization of the age and gender structure of the population of Canada, provinces and territories. The data presented cover the period from 1971 to the most recent year. The dashboard shows the proportion of the total population by broad age group, the proportion of centenarians, the distribution of the population by age and gender, the average age, the number of people aged 15 to 64 per person aged 65 years and older and number of men+ per women+ by age group. Data can be visualized for Canada or for a selected province or territory.
Quarterly demographic estimates, provinces and territories: Interactive dashboard

This interactive dashboard allows the user to visualize the factors of Canada's population growth and how they have changed over time for Canada, the provinces and territories. Statistics for the most recent quarter are also presented. The dashboard shows population, population growth, population weight, and factors of population growth (natural increase, international migration, interprovincial migration). The user can view the data for Canada or by selecting a province or territory of interest.
Canada's population clock (real-time model)

This data visualization product provides information on the pace of population renewal in Canada. The web page shows a real-time model of population growth in Canada. The components of population growth are modelled in order to adjust the population of the country, provinces and territories. Moreover, a map is showing in which provinces and territories the demographic events are occurring.
Data modelled in real time on this web page are not to be confused with Census counts and demographic estimates, which are the measures used to determine the size of the population in the context of various governmental programs.
Projections of the Indigenous Populations: Interactive Dashboard

This interactive dashboard provides an overview of Indigenous populations projections using the most recent results of the Demosim microsimulation projection model. Showing results coming from several projection scenarios, this tool allows users to quickly and easily explore data—such as population counts by geography and age group. Information for the overall Indigenous population as well as for specific Indigenous populations, notably, Registered Indians, First Nations people, Métis and Inuit are presented for all provinces and territories.
Fertility indicators, provinces and territories: Interactive dashboard
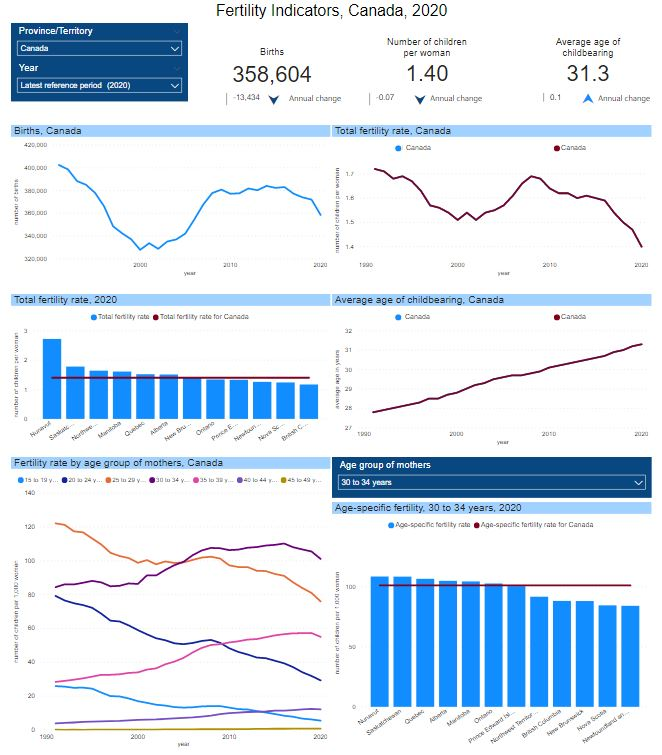
This interactive dashboard permits the visualization of various fertility indicators and how they have changed over time for Canada, provinces and territories. The dashboard shows the total fertility rate, the average age of childbearing, age-specific fertility rates, the number of births and the associated annual change. Data can be visualized for Canada or for a selected province or territory by year.
Population Projections for Canada, Provinces and Territories: Interactive Dashboard

This data visualization product provides interactive insights on the most recent population projections for Canada, provinces and territories. Showing results from several projection scenarios, this tool allows users to quickly and easily explore data, such as projections of population age distribution and components of projected demographic growth.
Population projections on immigration and diversity: Interactive Dashboard

This interactive dashboard provides an overview of population projections on immigration and diversity prepared using the Demosim microsimulation projection model. Showing results coming from several projection scenarios, this tool allows users to quickly and easily explore data-such as population counts by geography, age group and generation status. Information is presented for the overall Canadian population as well as for each racialized group at various geographic levels including census metropolitan areas, provinces and territories.
Interprovincial migration indicators, provinces and territories: Interactive dashboard

This interactive dashboard allows users to visualize the evolution of interprovincial migration over time, as well as by province or territory, by age group and by sex. The dashboard shows the levels of in-migrants, out-migrants and net interprovincial migration. It also presents values in the form of migration rates to facilitate comparisons between provinces and territories and between age groups. The data included covers the period 1971/1972 to the most recent period.
Interprovincial migrants by province or territory of origin and destination: Interactive dashboard

This interactive dashboard allows users to visualize the evolution of interprovincial migration over time as well as by province or territory of origin and destination. The dashboard shows net interprovincial migrants between two provinces or territories from 1971/1972 to the most period for which data is available. Users can select the provinces or territories of origin and destination of their choice from the filters located at the top of the dashboard. The number of interprovincial migrants for every combination of province or territory of origin and destination can also be viewed in a table by selecting the period of interest using the appropriate filter.
Baby Names Observatory

This interactive dashboard visualizes the popularity of baby names over time for Canada. The dashboard displays the top 20 baby names by selected year for both boys and girls. It is also possible to search for a particular first name by sex at birth to see the historical evolution of the first name in terms of frequency, the proportion of children with the chosen name and the annual rank.
- Date modified: