
Statistics Canada
www.statcan.gc.ca
Common menu bar links
GIS update

Archived Content
Information identified as archived is provided for reference, research or recordkeeping purposes. It is not subject to the Government of Canada Web Standards and has not been altered or updated since it was archived. Please "contact us" to request a format other than those available.
By May Luong
Full article in PDF format
- GIS take-up increased between 2000 and 2006
- Application rates also increased
- Who's eligible but not applying?
- Eligible seniors more likely to apply in 2006
- Summary
- Data sources and definitions
In 2006, an estimated 1.4 million eligible seniors received the Guaranteed Income Supplement (GIS). Nevertheless, approximately 159,400 eligible seniors were not receiving any GIS (Table 1). While the 2006 number reflects an improvement in the GIS take-up by historical standards, understanding the characteristics of eligible non-recipients remains important (see GIS eligibility).
The GIS was established in 1967 to provide additional benefits to low-income Old Age Security (OAS) recipients in Canada. The combined retirement income system comprising OAS, the GIS, the Canada and Quebec Pension Plans, and private pensions has dramatically reduced the incidence of low income among seniors over time (Myles 2000). However, in 2001, the Standing Committee on Human Resources Development and the Status of Persons with Disabilities found that a substantial number of eligible seniors were not receiving the GIS (HUMA 2001). In response, ongoing efforts by Human Resources and Skills Development Canada (HRSDC), in conjunction with the Canada Revenue Agency (CRA), have aimed to reduce the number of eligible non-recipients through increased outreach activities and a simplified application process (see GIS initiatives and outreach programs).
To be eligible for the GIS, individuals must be entitled to receive OAS and must meet specific requirements based on their annual family income. For example, as of April 2009, seniors filing their income tax returns as a single person had to have income below $15,672. The maximum monthly benefit from April to June 2009 for singles was $652.51 (see GIS eligibility).
Prior to 1999, HRSDC required individuals to re-apply for benefits every year by submitting an application form with a detailed income statement. Since 1999, recipients filing an income tax return have been automatically renewed every year. Those not filing a return must still submit an application with a detailed income statement. However, tax filers who lost their entitlement in one particular year because their income exceeded the threshold were required to re-apply. Many eligible seniors likely did not receive the GIS because they were unaware they had to re-apply after losing their entitlement. In 2007, with the passing of Bill C-36 amending the Canada Pension Plan and the Old Age Security Act, the issue of eligible seniors not applying after loss of entitlement in one year was eliminated—eligible seniors now need only file an income tax return or an income statement every year after their initial application to receive supplemental benefits for those years in which their income is below the GIS cut-off.
While the data cannot directly answer why eligible seniors do not apply, possible reasons include isolation, lack of awareness of the program and its application process, physical or mental health problems, language barriers, low literacy skills, or homelessness. In addition, a survey by HRSDC found that some seniors do not apply for the GIS for religious or moral reasons, perceiving the GIS as welfare (HUMA 2001).
Among senior families, those receiving the GIS appear to be the least well-off. A previous study found the median wealth of unattached GIS recipients to be only one-sixth that of unattached non-recipients.1 GIS families were more vulnerable financially than other senior families and less able to handle an unexpected major expense (Poon 2005). In addition to having a lower income as a result of not receiving the GIS, eligible non-recipients also face secondary effects. For example, in many provinces prescription drug plans, income supplements, heating oil subsidies and home care assistance programs base eligibility on receipt of the GIS (HUMA 2001). Hence, eligible non-recipients are likely to gain not only financially from GIS benefits but possibly also from other programs.
Two sources are available to study GIS-eligible non-recipients: longitudinal administrative data and longitudinal survey data. While the administrative data provide longer time frames and much larger samples, they lack information on personal characteristics (other than age, sex and marital status) that could help explain eligibility and application patterns. Surveys generally span shorter periods and have smaller samples, but are rich in personal and socio-economic information.
Using the 1999 to 2001 Survey of Labour and Income Dynamics (SLID), an earlier study (Poon 2005) looked at eligible seniors not receiving the GIS. The current study updates the findings to 2005 and 2006. More specifically, it examines changes in the GIS take-up and application rates between 2000 and 2006. Logistic regressions estimated the probability of not applying for the GIS even when eligible, while holding other characteristics constant. In addition, the characteristics associated with the likelihood of not applying were compared over time.
GIS take-up increased between 2000 and 2006
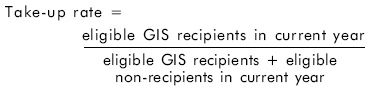
The take-up rate is individuals receiving GIS benefits as a percentage of the total eligible for the GIS (see Data sources and definitions). Between 2000 and 2006, eligible non-recipients declined from approximately 191,700 to 159,400,2 while the total senior population increased from 3.6 million to 4.0 million (Table 1). The estimate of seniors in both the Longitudinal Administrative Databank (LAD) and SLID is below the 4.3 million reported in the 2006 Census. The lower number in LAD is mainly due to the requirement for individuals to file income tax returns for two consecutive years in order to be included. Seniors are under-represented in SLID because the survey covers about 97% of the Canadian population, excluding those in the territories, in institutions, on First Nations reserves and in military barracks.
Overall, the population and the number of eligible GIS recipients and non-recipients estimates from SLID are in line with those from tax data. The differences arise mainly because LAD represents 20% of all tax filers, while SLID is a survey with a much smaller sample size. In this study, SLID is used for socio-demographic information not available in LAD. However, LAD would be more accurate for estimating the total number of eligible non-recipients.
In 2006, take-up was higher for most groups as the overall rate rose from 87% in 2000 to 90% (Table 2). As might be expected, those entitled to higher benefits ($2,000 or more) had the greatest take-up rate in both 2000 and 2006. And although significant increases were seen for the two lowest payment groups (less than $500 and $500 to $999), their take-up rates were still significantly lower than the top group's rate. Take-up in the less than $500 group increased from 55% to 72%, and in the $500 to $999 group from 70% to 82%. It may be that some eligible seniors in these low-payment groups choose not to apply for the GIS as the amounts may be too small to trigger interest or to compensate for going through the application process.
Individuals age 70 and over also experienced significant improvement in their take-up rates in 2006. Both men's and women's rates improved significantly. While women had a higher take-up rate in 2006, the increase between 2000 and 2006 was slightly greater for men.
Improved rates were also seen for those with good or fair health, homeowners and immigrants. Although take-up rates increased in all provinces except Quebec, the increase was statistically significant only in Ontario. Overall, these improvements brought other provinces more in line with high levels of take-up already observed in Quebec and the Atlantic provinces.
Application rates also increased
The application rate is the proportion of GIS recipients who did not receive payments in the previous year and therefore had to apply to receive them in the current year (see Data sources and definitions). The take-up rate provides information on who is receiving the GIS and the application rate on who applies for the GIS when eligible. For instance, the take-up rate includes a large portion of recipients who are automatically renewed each year, but some individuals lose their eligibility in a given year if their income exceeds the GIS cut-off during that year. If their income subsequently falls below the GIS cut-off and they regain eligibility, they have to re-apply for benefits.
Overall, 45% of all eligible seniors required to apply for the GIS in 2000 submitted an application. Eligible seniors may not apply for the GIS for many reasons. For example, they may not be aware of the program or how to apply. In the current study period, Bill C-36 had yet to be passed. Those who lost eligibility may not have realized they had to re-apply when they regained eligibility. Regardless of the reasons, a parliamentary committee concluded in 2001 (HUMA 2001) that not enough was being done to reach ‘non-subscribed' seniors. Since then, the application process has been simplified and several outreach programs implemented to raise awareness of the GIS (see GIS initiatives and outreach programs).
By 2006, the application rate had increased significantly to almost 57%. One of the most significant increases was for those with annual GIS benefits of less than $500—between 2000 and 2006, their application rate increased more than 20 percentage points and ceased to be significantly different from the rate of those with benefits of $2,000 or more.
In both 2000 and 2006, the application rate was highest for persons age 65 to 69. However, those 80 and over made the largest gains during the period, followed by those 70 to 79. Application rates for men and women also increased significantly, about 15 and 10 percentage points respectively.
In 2000, the application rates for persons with some secondary education, high school graduates and postsecondary studies (completed or not) were not statistically different from the rate for those with less than a grade 9 education. Nevertheless, by 2006, the application rate increased significantly for those with some secondary education and high school graduates.
Higher application rates were also noted for Ontario and Manitoba/Saskatchewan, the unattached, married elderly couples, retirees, those with good or fair health, and both immigrants and non-immigrants.
Who's eligible but not applying?
Logistic regression provides further insight into the characteristics of eligible recipients while controlling for other characteristics. Separate models were run for 2000 and 2006 to test for the statistical significance of differences across characteristics within each panel. For cross-panel comparisons, data for 2005 to 2006 were stacked onto 1999 to 2001 data. Separate regressions were run using different reference profiles in order to test whether coefficients were statistically different between the two panels.3 In addition, logistic models were tested separately by sex but few differences were found. Therefore, the models in this section include both men and women.4
In general, the samples were quite small, often leading to large standard errors, which may result in type II error.5 In other words, the models may show very little statistical significance with the current sample sizes, whereas larger samples would produce more precise estimates, leading to smaller standard errors. Nevertheless, some significant differences between 2000 and 2006 were noted.
Overall, the probability of not applying for the GIS when eligible decreased significantly for the older age groups (70 to 79 and 80 and over) between 2000 and 2006 (Table 3). In other words, individuals 70 and over were much more likely to apply for the GIS in 2006 than in 2000. An increase in the likelihood of older seniors applying is particularly noteworthy since older seniors may also tend to be more isolated and financially vulnerable. Nevertheless, despite decreases in the probability of older seniors not applying in 2006, they were still significantly more likely to not apply than those age 65 to 69.
In 2000, the probability of not applying when eligible was significantly related to the annual GIS entitlement. That is, eligible seniors qualifying for benefits of $2,000 or more were the least likely not to have applied. However, by 2006, they were no longer statistically different from other benefit groups in their likelihood of not applying. This is likely due to the increase in the application rate of those with annual benefits of less than $500.
Overall, the probability of not applying when eligible fell between 2000 and 2006. However, the changes were statistically different only for some variables. Nevertheless, the results of a joint-significance test for all interaction terms between each variable and a panel indicator suggest that the overall pattern of non-application changed significantly.
Eligible seniors more likely to apply in 2006
Given that at age 65 seniors applying for OAS can simultaneously apply for the GIS, their application process is much simpler than for those who lose their eligibility and are required to re-apply in a subsequent year. In order to understand the factors associated with re-applying for the GIS, 65 year-olds were dropped. In addition, the exclusion of those age 65, who likely were first-time applicants, allowed for an examination of the pure age effect.
Between 2000 and 2006, the number of eligible seniors age 66 and over who applied almost doubled (from 78,000 to 151,600), while the number eligible but not applying fell (from 189,000 to 146,400).
Logistic regressions were repeated for this sub-sample of eligible seniors.6 The smaller sample size decreased the precision of the estimates, resulting in larger standard errors and p-values.
Overall, the results were similar to the full-sample model (Table 4). However, the probability of not applying when eligible was much higher. In contrast with the full-sample model, the age effect was no longer significant in 2006 once the 65 year-olds were dropped, suggesting that the age effect found in the full model probably resulted from individuals age 65 being more likely to apply since they can apply for the GIS in conjunction with the OAS.
A joint-significance test, where all interaction terms and the panel dummy were tested, yielded results similar to the full-sample analysis: the overall pattern of non-application changed significantly between the 2000 and 2006 cohorts.
Summary
Since the GIS was established, many seniors with little or no income other than OAS have benefited from the extra income. The GIS in conjunction with the combined retirement income system has been instrumental in reducing the number of seniors living in low income. Nevertheless, a previous study found that, in 2000, a large number of eligible seniors were not receiving the GIS (Poon 2005). In response to the recommendations of a House of Commons standing committee, HRSDC and the Canada Revenue Agency addressed this issue by simplifying the application process and initiating outreach efforts to increase awareness of the GIS program. In addition, HRSDC and CRA have shared information in order to reach potential beneficiaries.
Between 2000 and 2006, the number of eligible non-recipients fell as take-up rates rose. The largest increases were for those receiving annual GIS payments of less than $500 and $500 to $999—up 17 and 12 percentage points respectively—possibly because of the simplified application process. Seniors may now be more inclined to go through the application process even for small GIS payments since the time cost of the less complex application process is now lower.
At the same time, the number of seniors applying for the GIS rose from approximately 154,200 to 209,700, representing an increase of 36%. The largest improvements were among those 80 and over, who saw an increase of 27 percentage points, followed by those 70 to 79 at almost 25 points. Regionally, Manitoba/Saskatchewan and Ontario had the largest increases (23 and 19 points respectively).
Overall, the statistical models corroborate the descriptive analyses. The models indicate that although annual GIS payment amounts in 2000 were negatively related to the likelihood of not applying, this was no longer the case in 2006. This is likely due to the significant jump in the GIS application rate among those receiving less than $500 in 2006. Overall, the results suggest that, by 2006, those receiving small GIS payments were just as likely to apply as those receiving the maximum.
The probability of not applying also fell significantly between 2000 and 2006 for the two oldest age groups (70 to 79 and 80 and over). And when first-time automatic applicants (age 65) were excluded, the probabilities for the two oldest groups were no longer statistically different from the youngest age group (66 to 69), suggesting that, by 2006, older seniors were just as likely to apply as younger seniors.
Significant increases were seen in the GIS take-up and application rates during the 2000 to 2006 period as HRSDC implemented a number of initiatives and changes in the GIS application process. Now, with the passing of Bill C-36, seniors need apply only once to receive GIS payments for all years of eligibility. The impact on take-up and application rates will be seen when more recent data become available.
Data sources and definitions
The Survey of Labour and Income Dynamics (SLID) covers roughly 97% of the Canadian population, excluding those in the territories, in institutions, on First Nations reserves or in military barracks. Each panel of respondents, approximately 15,000 households and 30,000 adults, is surveyed for six consecutive years. A new panel is introduced every three years, so two panels always overlap. This study used the combined overlapping samples for 1999 to 2001 and 2005 to 2006. While three years were available for the initial analysis (1999 to 2001), only two years were available for the update (2005 to 2006) as 2007 was not yet available. However, since 2001 was used only for the imputation of a limited number of cases, the lack of 2007 data likely had a minimal effect on the overall conclusions of the study.
The Longitudinal Administrative Databank (LAD) consists of a 20% sample of Canadian tax filers. Once selected, individuals are in the sample for every year they file a return. In addition, part of each year's sample includes individuals appearing for the first time, making the sample current and cross-sectionally representative. In 2000, LAD carried nearly five million individuals.
Eligible non-recipients are individuals age 65 and over deemed eligible for GIS benefits but not receiving any payments for the reference year. They are divided into four groups: single, married to a non-pensioner, married to a pensioner, or married to an ‘Allowance' recipient. (The Spousal Allowance provides money for low-income seniors age 60 to 64 whose spouse or common-law partner is receiving or entitled to OAS and the GIS. Allowance recipients must be a Canadian citizen or a legal resident at the time the Allowance is approved or when they last lived in Canada. They must also have lived in Canada for at least 10 years since age 18.) Since one criterion for eligibility is receiving OAS, OAS non-recipients are automatically classified as GIS non-eligible.7 Income as defined for the GIS was then calculated for each record based on 1999 or 2005 income. For married or common-law couples, the combined income of the pensioner and the spouse or partner was taken into account. Family-level cut-offs were then used to determine eligibility in 2000 and 2006. The cut-offs published by HRSDC are for those receiving the maximum OAS; for those not receiving the maximum, the cut-offs depend on the individual's OAS benefits.8 Records were checked to see if the GIS was received in 2000 and 2006 to classify respondents into three groups: not eligible, eligible and receiving, and eligible but not receiving.9 Theoretical payment amounts were calculated for eligible non-recipients while actual payment amounts were used for recipients.
The take-up rate is GIS recipients as a percentage of those eligible.
The application rate is GIS recipients in 2006 (2000) not receiving GIS in 2005 (1999) as a percentage of the total GIS recipients in 2006 (2000) not receiving GIS in 2005 (1999) plus the eligible non-recipients in 2006 (2000).
For example:
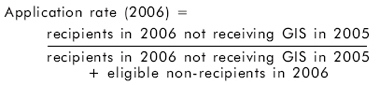
GIS recipients in 2006 (2000) who did not receive the GIS in 2005 (1999) were assumed to represent those applying for the GIS in 2006 (2000)—they were not automatically renewed since they received no payments the previous year. The eligible individuals in 2006 (2000) who were not receiving the GIS in 2005 (1999) represented those who could have applied in 2006 (2000).
GIS initiatives and outreach programs
Since 2002, Human Resources and Skills Development Canada (HRSDC), Service Canada (SC) and the Canada Revenue Agency (CRA) have shared information in order to reach potential beneficiaries.
In 2002, HRSDC and CRA started targeting low-income seniors whose tax returns indicated potential eligibility for GIS benefits. Since then, HRSDC has mailed out simplified application forms to these individuals with pre-filled information based on their returns. In 2003, HRSDC further simplified the process by reducing six GIS application forms to two and providing instruction sheets. In 2007, with the passing of Bill C-36, which amended the Canada Pension Plan and the Old Age Security Act, the requirement to re-apply once an initial application had been made was waived. Recipients who filed income tax returns would never have to re-apply and would receive GIS payments for all years that their income met the specific requirements (HRSDC 2007).
HRSDC launched a national GIS ad campaign in 2002 to increase awareness and target seniors who had not yet applied. The campaign consisted of television, radio and newspaper ads. In addition, outreach efforts were directed at the most vulnerable, for example seniors living in isolation, the homeless, people with disabilities, immigrants and Aboriginals. These efforts included booths and information kits at malls and fairs, media hot spots, targeted mailings, and providing trained service providers. Efforts were also targeted at community organizations with access to hard-to-reach seniors. Other outreach initiatives included information letters sent from CRA on behalf of HRSDC and SC to individuals 65 and older who were not receiving OAS or the GIS.
Models
Separate logistic regressions were run for 2000 and 2006 to examine the characteristics associated with whether an eligible individual applied during that year. The sample sizes were 895 (representing 345,800 seniors) in 2000 and 876 (369,100) in 2006. Logistic regression estimates the probability of a particular outcome (here, not applying when eligible) as a function of several explanatory variables. The association between each explanatory variable and the outcome was examined while holding all other variables constant. To account for the complex survey design, bootstrap weights were used.
To test whether coefficients were significantly different between the years, all else constant, the two data sets were stacked including the bootstrap weights. A panel dummy was created and set to 0 for respondents in 2000 and to 1 for 2006. Interaction terms between the panel dummy and specific variables were included in the model. These comprised age group, GIS amount, health status, education, and region of residence. Other variables such as economic family, sex, major activity, immigrant status, and home ownership were initially included but were subsequently dropped as they showed no statistical significance and their inclusion did not improve the model.
GIS eligibility
To be eligible for the GIS, an individual must be entitled to OAS and meet the income requirements. Individuals are eligible for OAS if they are 65 or over, a Canadian citizen or a legal resident, and have lived in Canada for at least 10 years after age 18 if currently living in Canada, or for 20 years after age 18 if living outside Canada.
The maximum annual incomes used for this study are different from those listed here (Table 5) since the reference periods were 2000 and 2006. The maximum annual income and monthly benefit increase every quarter to reflect inflation. For example, in 2006, the maximum annual income for single persons was $14,352.
The author would like to thank Preston Poon for his support and generous assistance.
Notes
- GIS non-recipients, including both OAS recipients and non-recipients.
- The estimated number of eligible non-recipients in Poon 2005 is slightly different than in this study, mainly because Poon used current-year income to estimate current-year eligibility for those whose income was missing in the previous year, while this study simply excluded individuals with missing previous-year income. Nevertheless, the results for the models and the descriptive statistics are almost identical.
- Bootstrap weights for the two data sets were also stacked and utilized in the regression.
- Other variables tested but subsequently dropped for lack of statistical significance and explanatory power were sex, education, immigrant status, home ownership, major activity, and economic family type. The exclusion of these variables did not greatly affect the coefficients of the remaining independent variables. Health status and region were included despite their lack of statistical significance because their exclusion greatly affected the coefficients of the other remaining variables. However, their inclusion did not change the statistical significance of the other variables and the general conclusion of the models.
- A type II error is not rejecting the null-hypothesis of no statistical significance when it should have been rejected.
- Similar to the full-sample model, other variables were tested but subsequently dropped as they did not show any statistical significance within panel or over time.
- Those who have not applied for OAS, have had their OAS clawed back or are not eligible for OAS (i.e. do not meet the residence requirements) are all considered GIS non-eligible.
- In general terms, the GIS for those receiving partial OAS benefits will be higher by an amount equivalent to the difference between the maximum OAS and their OAS benefits. This was not accounted for in the analysis. However, partial OAS recipients make up only a small portion of domestic recipients (4% in 2000 and 6% in 2006).
- A number of assumptions were made to account for the difference in payment year (July to June) versus calendar year: an eligible non-recipient remained a non-recipient for the entire year; an individual receiving the GIS in 2000 or 2006 but not eligible based on 1999 or 2005 income was classified as being not eligible and not receiving if they reported GIS in 1999 or 2005; an individual receiving the GIS in 2000 or 2006 but not eligible based on their 1999 or 2005 income and reporting no GIS in 1999 or 2005 was classified as being an eligible recipient who received an option (under certain circumstances, like retirement, an individual can request that an income estimate be used rather than their actual income). These assumptions were not expected to have a significant effect on the results.
References
Human Resources and Social Development Canada. 2007. Canada's New Government Improves Access to Canada Pension Plan and Old Age Security Benefits. News release. May 3. Ottawa. (accessed June 17, 2009).
Myles, John. 2000. The Maturation of Canada's Retirement Income System: Income Levels, Income Inequality and Low-income Among the Elderly. Statistics Canada Catalogue no. 11F0019MPE – No. 147. Analytical Studies Branch Research Paper Series. Ottawa: 21 p. (accessed June 17, 2009).
Poon, Preston. 2005. “Who's missing out on the GIS?” 2005. Perspectives on Labour and Income. Vol. 6, no. 10. October. Statistics Canada Catalogue no. 75-001-XIE. p. 5-14. (accessed June 17, 2009).
Standing Committee on Human Resources Development and the Status of Persons with Disabilities (HUMA). 2001. The Guaranteed Income Supplement: The Duty to Reach All. Sixth report. Judi Longfield, M.P., Chair. Ottawa. House of Commons. (accessed June 17, 2009).
Author
May Luong is with the Labour and Household Surveys Analysis Division. She can be reached at 613-951-6014 or perspectives@statcan.gc.ca