|
||||||

|
Literacy countsWhat is 'literacy'? What is 'literacy'?Literacy is crucial to the success of individuals in both their career aspirations and their quality of life. It is more than a basic reading ability, but rather an indication of “how adults use written information to function in society.”1 Strong literacy skills are closely linked to the probability of having a good job, decent earnings, and access to training opportunities. Individuals with weak literacy skills are more likely to be unemployed or, if employed, to be in jobs that pay little or that offer poor hours or working conditions. Traditionally, literacy has referred to the ability to read, understand, and use information. But the term has come to take on broader meaning, standing for a range of knowledge, skills and abilities relating to reading, mathematics, science and more. This reflects widespread and deep changes that have taken place in technology and in the organization of work over the past quarter century. The ability to use and apply key mathematics and science concepts is now necessary across a wide range of occupations. Why is literacy important?Literacy is fundamental for learning in school. It has an impact on an individual's ability to participate in society and to understand important public issues. And it provides the foundation upon which skills needed in the labour market are built. Technology, and the science behind it, permeates all aspects of our lives, from how we work and communicate to what we shop for and how we pay our bills. The complexity of today's world means that individuals need to have some level of proficiency in reading, mathematics and science in order to understand and participate fully in economic and social life. A population's literacy skills also have a bearing on how well a country performs economically. The world we live in today is vastly different from that of a generation ago. Technological change has transformed the way in which work is done; competition in many industries is global in nature; and the industrial structure of the Canadian labour market has rapidly evolved from a manufacturing and agricultural base to one based on services. These changes have, in turn, brought rising skill requirements. Countries that are successful in endowing their populations with strong skills are usually in a better position to meet the economic challenges of operating in a globalized information economy. Finally, having a population that has strong literacy skills also places a country in a better position to meet the complex social challenges that it faces. For example, strong literacy skills are linked to better health outcomes for individuals. A highly literate population will be better able to deal with issues of governance in a highly diverse society. And informed debate is needed to help us determine how best we can allocate scarce resources across competing priorities, such as education, health, investment in infrastructure, and social programs. Measuring student achievementA key indicator of educational progress is the extent to which schools are successful in equipping their students with strong literacy skills. This indicator consists of two components. The first component relates to how well students perform on average, with higher average scores indicating, at a national or provincial level, stronger academic achievement overall. The second component concerns the range in scores between the top-performing students and those at the bottom of the distribution. Equity considerations suggest that a system that is able to achieve high scores through the strong performance of all students, regardless of their backgrounds, would be preferable to one where a strong average was the product of a small proportion of superachievers. There are efficiency reasons for wanting to reduce the size of the gap between the top and the bottom as well-the evidence shows that countries or provinces that have a narrower achievement gap also tend to have higher average literacy scores than those where that gap is larger. Canada near the top on average achievement scoresThe Programme for International Student Assessment (PISA) is an international effort to measure student literacy in reading, mathematics and science. The PISA assessment is intended to go beyond the testing of school-based curricula in order to assess the extent to which students approaching the end of compulsory education have mastered the knowledge and skills encompassed by each of these three literacy domains. Tests were administered to 15-year-olds in 2000.2 Data are available for 32 countries and for each of the 10 Canadian provinces. Overall, Canadian students performed very well on the PISA assessment. Only Finland (in reading), Japan and Korea (in mathematics) and Finland, Japan and Korea (in science) had higher average scores than Canada. Furthermore, Alberta (in all three domains) and Quebec (in mathematics and science) ranked among this top tier of countries in 2000. And while Nova Scotia, Prince Edward Island, and Newfoundland and Labrador scored below the Canadian average, they all ranked above the average for all countries in the Organisation for Economic Co-operation and Development (OECD). New Brunswick's score was about the same as the OECD average. Therefore, with respect to efficiency-as indicated by the performance of Canadian students, on average, and of students in Alberta and Quebec, in particular-Canada stands out as being more successful on the PISA assessments of academic achievement than many other countries.
i Countries and provinces are ordered
within each category by average score. Inequality in reading scoresBut that is only one part of the equation. The other part is equity. In fact, education systems that are able to achieve greater equity in student performance by reducing the size of the gap between higher-performing and lower-performing students, while maintaining the high scores at the top, will achieve higher average scores overall. Think of student scores as falling along a continuum, with the top score being a fixed point or a pivot. Higher average performance would be achieved by swinging lower-achieving students up—in effect, creating a flatter, higher playing field. The challenge, of course, is to accomplish this without sacrificing achievement at the high end of the scale. A measure of the distribution of scores within and across countries is obtained by constructing an inequality index. This index consists of the ratio of the score at the 90th percentile to that at the 10th percentile.3 The higher the ratio of inequality, the greater is the difference between the scores of the top and bottom 10% of students; a ratio close to 1.0 indicates that all students in a country achieve nearly the same score. On this count, Canada also fares well. For example, in 2000, the inequality index for reading scores in Canada was 1.59. This compares to 1.52 in the case of Finland and 1.54 in the case of Japan. The United States ranked behind Canada, at 1.75. Germany with an index of 1.85, was one of three countries with the highest ratios of inequality. The inequality index also tells us something about provincial differences.4 First, the variation in the index across provinces is much narrower than it is internationally, ranging from 1.57 in both Saskatchewan and Quebec and 1.59 in Alberta to 1.67 in Nova Scotia and 1.68 in New Brunswick. Thus, while the performance gap has not been reduced to the same extent in all ten provinces, they are more alike than the G-8 countries, for example. Second, consistent with the finding that jurisdictions with higher average scores also tend to have less inequality in scores across students, Quebec and Alberta both show relatively low inequality in student reading literacy compared with many countries. The exception is Saskatchewan which ranks along with Quebec and Alberta, with a reading inequality index of 1.57. The chart below shows the relationship between average achievement scores
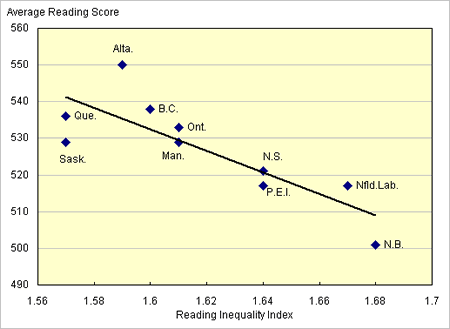
and inequality scores for reading for the 10 provinces in 2000. First,
we note that while the relationship is not perfect, there is a pronounced
tendency for high average achievement to be associated with lower inequality,
as indicated by the downward slope of the distribution. Figure 1. Higher overall achievement is associated with a smaller performance gap between students
Source: Statistics Canada, 2001, Measuring Up: The Performance of Canada’s Youth in Reading, Mathematics and Science. OECD PISA Study: First Results for Canadians Aged 15, Catalogue number 81-590-XIE Second, the chart points to some anomalies. For example, in terms of reading achievement, Quebec and Saskatchewan show the least amount of variation across students. On the other hand, Alberta scores higher than those provinces on the reading inequality index, but also ranks higher than other provinces on the average reading literacy score. Similarly, Newfoundland and Labrador scores higher on average reading literacy than would be expected, given its score on the inequality index. The role of socio-economic statusMany factors affect the size of the achievement gap. One important factor is socio-economic status (SES), which is typically measured based on parents’ education attainment, occupation, and/or income. Numerous studies in many countries have found that there is a strong tendency for students from families with higher SES to achieve higher scores than students from families with lower SES. However, it is also the case that countries with high average reading achievement tend to have less variability in scores across SES groups. The PISA results show that Canada had not only a smaller gap in achievement between students from different backgrounds but also high scores across SES groups. Germany, on the other hand, had the greatest gap in achievement when students with different SES backgrounds were compared. Similar results were found for mathematics and science achievement. However, as we have seen, family SES does not have a fixed effect. Some jurisdictions have made better progress in reducing the negative impact of low SES than others and individual schools vary in their success in this regard. The evidence also suggests that parents who are interested in and involved with their children’s education and who provide a home environment that stimulates learning have a positive impact on their children’s outcomes, regardless of their SES. Achieving both high average literacy scores and low inequality scores are desirable, and as we have seen, compatible goals. Part of the policy equation is understanding and assessing which policies and practices work best so that all students can benefit, regardless of where they live or how well off their parents are. ReferencesThe article, Literacy counts, is based on Statistics Canada, 2003, Education indicators in Canada: Report of the Pan-Canadian Education Indicators Program, Catalogue number 81-582-XIE and Statistics Canada, 2001, Measuring Up: The Performance of Canada's Youth in Reading, Mathematics and Science. OECD PISA Study: First Results for Canadians Aged 15, Catalogue number 81-590-XIE. Notes
|
|