

|
|
A first look at provincial differences in educational pathways from high school to college and university
Klarka Zeman
Centre for Education Statistics
Statistics Canada
The gender gap
Getting to postsecondary education
Choosing university
Choosing college
The income gap
Conclusion
Issues around access to higher education have received considerable attention in recent years. Youth who are unable to obtain a postsecondary qualification are at a great disadvantage in the labour market and more generally in terms of other measures of well-being such as life satisfaction and health. In particular, two groups of youth have been identified as at risk for accessing higher education: boys and youth from lower income backgrounds.
Much has been made of the dramatic increase in the postsecondary participation of young women. Within the last thirty years, young women have gone from lagging behind young men in going to postsecondary education to overtaking them, thus prompting the question, what has happened to the boys? Why are they lagging behind their female counterparts in terms of high school completion rates and postsecondary participation?1
It has also been widely observed that youth from lower-income backgrounds are considerably less likely to pursue higher education than their more well-to-do counterparts. Is this an issue of tuition fees that are too high for lower-income families to afford or do lower-income youth face barriers before they even get to the point where they might consider going to postsecondary education?
A recent report by Marc Frenette investigated the differences between the university participation rates of youth from lower-income backgrounds versus those from higher-income backgrounds at the national level.2 He found that certain factors such as standardized test scores in reading obtained at age 15, school marks reported at age 15, parental influences, and high school quality accounted for 84% of the gap in university participation between youth from the lowest income quartile and youth from the highest income quartile. In contrast, financial constraints accounted for 12% of this gap.
While these studies and others have looked at the differences in high school completion and postsecondary participation rates between the genders and income groups, due to data limitations, these types of comparisons have not been made at the provincial level. With the availability of the latest wave of the longitudinal Youth in Transition Survey (YITS), provincial comparisons of these differences are now possible.3
This article looks at the educational choices youth make between the ages
of 15 and 19. Between these, youth have three decisions to make: first,
whether or not to graduate from high school; second, whether or not to
go to postsecondary education; and finally, the type of institution in
which to pursue postsecondary education. The authors examine these
pathways to see if there are any differences between the provinces in
the choices made by boys versus girls and by youth from lower-income backgrounds
versus those from higher-income backgrounds.
Box 1
The data: The target population
The target population for the Youth in Transition Survey (YITS), cohort A includes all 15 year-old students enrolled in an educational institution in Canada on December 31, 1999. Students were initially interviewed in April or May of 2000 and re-interviewed in February to May of 2002 and again, between February and June of 2004. Youth were questioned about their school and work activities for the two-year period directly prior to the interview date. Thus, the high school dropout and postsecondary participation rates presented here refer to the youth’s schooling status as of December 2003, the last date for which data were collected. These results are representative of Canadian youth who were 15 years old as of December 1999.
Finishing high school
In general, the lesson that high school is the minimum requirement for the labour market is one that Canadian youth have learned quite well. Recent analysis of dropout trends using data from the Labour Force Survey (LFS) shows that dropping out before completing high school is becoming less common in all parts of Canada.4 The decline has been most apparent in eastern Canada. On average for the 1990-1991 to 1992-1993 school years, about one in five 20 to 24 year-olds had not completed high school and were not attending school in Newfoundland and Labrador and Prince Edward Island, the highest rates in the country at the time. However, over the period 2002-2003 to 2004-2005, the drop-out rate in both these provinces was in the 8% to 10% range, ranking them among the lowest in Canada. Drop-out rates also fell sharply in Nova Scotia and New Brunswick.
YITS data show that the Canadian average high school dropout rate for 19 year-olds in 2003 was 7.4%. In several provinces, a greater percentage of boys than girls had left high school by the age of 19 without graduating. As can be seen in Chart 1, this difference was greater in some provinces than in others. Dropout rates were particularly high for boys in Quebec in 2003.
Chart 1
High school status at age 19, by gender and province, 2003
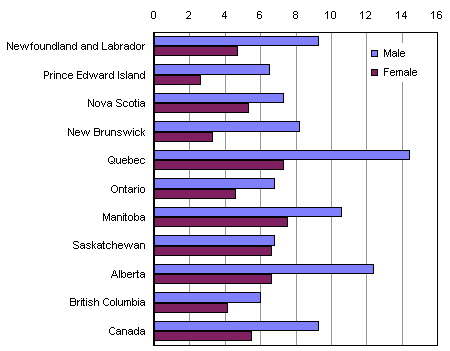
Sources: Table 1.
In the Maritime provinces, while overall dropout rates were relatively
low in 2003 compared to other provinces, there were relatively large
gaps in high-school leaver rates between boys and girls (see Box 2).
The one exception in the region was Nova Scotia. While there was a
smaller gender gap in the school leaver rate in that province, the gap in
graduation rates was nevertheless substantial (90.1% of girls had graduated
high school by age 19 in 2003 versus 83.0% of boys). This is explained by
the fact that a fairly large proportion of boys (1 in 10) in Nova Scotia
were still in high school at the age of 19. Other provinces with smaller
gender differences in leaver rates include Saskatchewan, Manitoba and British
Columbia. In Saskatchewan, the school leaver rates were nearly identical
at 6.8% for boys and 6.6% for girls.
Box 2
Methods: Measuring relative versus absolute gaps
This article focuses on the gaps in high school dropout and postsecondary participation rates between the sexes and between family-income groups. These gaps can be measured in either absolute or relative terms. The absolute gap is simply the difference between two rates, whereas the relative gap measures the size of the difference between two groups.
The method of measuring the gap becomes particularly important when comparing the size of the gaps across provinces. In this article, we are interested in questions such as: which provinces have a larger gap in high school dropout rates between boys and girls or between students from families with different income levels? Thus, it is the relative size of the differences in rates that are of interest. As a consequence, it may be that while overall dropout rates for both boys and girl in one province are high, the gap between the two is small. However, in another province, while dropout rates for boys and girls may be significantly lower than in the first case, the dropout rate for boys may nonetheless be significantly higher than for girls; the result will be a relative gap that is higher than in the first case.
Overall, at the national level in 2003, 61.9% of Canadian youth had attended some form of postsecondary institution (university or college5) by the age of 19. Females attended at a higher rate (69.3%) than males (54.5%). Considering only high school graduates, 76.1% of females had attended postsecondary education versus 64.3% of males. Thus, boys both graduate high school at a lower rate than girls and even if they have graduated, they go on to postsecondary education at a lower rate.
Among the provinces, there were some differences in high school graduates’ overall postsecondary participation rates, by gender. Quebec had the highest participation rate among high school graduates in 2003 (see Box 3). Postsecondary participation rates were also high in Nova Scotia and Ontario; these rates were lower in Manitoba, Alberta and Saskatchewan (Table 2).
Box 3
Quebec’s CÉGEP system
It should be noted that the high school and postsecondary systems in Quebec differ from the other provinces in ways that are important to an analysis of schooling pathways between ages 15 and 19. First, the last year of high school in Quebec is Secondary V, which would be equivalent to grade 11 in other provinces. In the rest of the country, the last year of high school is grade 12. Thus, youth in Quebec normally graduate high school in the year they become 17, one year earlier than age 18 which is typical in other provinces.
After high school, youth in Quebec typically enter the CÉGEP system.
In CÉGEP, youth may choose to pursue a program which is the prerequisite
for university and which is normally completed in two to three years.
Or, they could choose to pursue a college-level program, typically a
three-year program, as an end in itself.
Consequently, compared to youth in other provinces, youth in Quebec typically
finish high school and start their postsecondary studies one year earlier,
and, if they choose to go to university, start one or two years later. As
a result, overall postsecondary participation rates tend to be higher in Quebec
than in other provinces, while the university participation rate, at age 19,
tends to be lower.
The smallest gap between male and female postsecondary participation rates
was in Nova Scotia with 109 girls attending some sort of postsecondary
education for every 100 boys. The largest gap was in Saskatchewan with
128 girls for every 100 boys going to postsecondary. The gap in Saskatchewan
is notable because while males and females graduated high school at similar
rates in that province, females were much more likely to pursue postsecondary
education.
Nationally, 35.6% of 19-year-old high school graduates had gone to university
by December 2003. This figure varied widely from province to province. In
Quebec, where youth typically first attend CÉGEP
before university, very few youth had reached university by age 19; as
a consequence, the university participation rate in Quebec, at 12.6%, was
considerably lower than the national average. The university participation
rate in Alberta was also lower than the national average at 34.2%. University
participation rates for high school graduates were higher in Nova Scotia (58.3%),
Prince Edward Island (53.8%) and New Brunswick (48.2%).
Similar to high school leaver rates and overall postsecondary participation rates, the gap between boys and girls in terms of university participation also varied widely by province. The relative gap between the sexes was largest in Quebec, Newfoundland and Labrador and Ontario, and was smallest in Alberta.
Previous research has found that when it comes to college participation, there are smaller differences between the genders and between different income groups than is the case for participation in university.6, 7 It has been found, for example, that college participation rates of male high school graduates are closer to those of females than is the case for university.
These findings change, however, if youth who are already in university
are excluded from the analysis.8 If
we only look at youth who, by age 19, had not chosen to go to university,
but instead had chosen between going to college versus no postsecondary
participation at all, a different picture emerges in some provinces.
In Ontario and Manitoba, among high school graduates who
were not attending university, girls were more likely than boys to go to
college (Table
3).
Thus, in these provinces, girls were more likely to graduate from high
school, they were more likely to go to university and, if they were not already
going to university, they were more likely to go to college than boys.
This stands in contrast to the picture painted by college participation
rates of all high school graduates. Those show that in every province,
boys and girls went to postsecondary education at similar rates. However,
in Ontario and Manitoba, this is not because boys are participating in postsecondary education at the same rate as girls, but rather that in these provinces, girls are
choosing university instead.
Finishing high school
At the national level in 2003, the high school dropout rate for youth from the lowest family-income quartile was 11.7% compared to 3.6% for those from the highest family-income quartile.
At the provincial level, the smallest differences in school leaver rates
between income groups were in British Columbia and Alberta (Table
4). On the other hand, there were large differences between income groups
in Manitoba and Newfoundland and Labrador, with those differences being
evident even between the first and third income quartiles – youth from
families in the lowest income quartile in Manitoba and Newfoundland and
Labrador were three times as likely as youth from families in the third
income quartile to drop out of high school.
Getting to postsecondary education
The province with the smallest relative difference in postsecondary participation
rates by family income quartile was Saskatchewan; the difference was largest
in Newfoundland and Labrador (Table 5).
In fact, among youth in the lowest family-income quartile, youth from Newfoundland
and Labrador, along with the Prairie provinces, had the lowest rate of
postsecondary participation. Conversely, in Quebec, where students typically
enter CÉGEP following high school, the rates of postsecondary participation
in both the lowest and the highest income quartiles were highest.
Choosing university
Similarly, there was a great deal of variation across provinces in the size
of the gap in university participation rates between youth from the lowest
and the highest family-income quartiles. What is striking, however, is
that it is not the provinces with the highest tuition fees that post the
largest difference in university participation rates between low-income
versus high-income youth. Chart 2 illustrates these differences, while
Table 6 shows the average undergraduate
tuition fees for 2003-2004.
Chart 2
University participation rates at age 19 of high school graduates, by family-income quartile and province, 2003

1 In Quebec, where youth typically first attend CÉGEP before university,
very few youth had reached university by age 19; as a consequence, the
university participation rate in Quebec was considerably lower than the national
average.
Sources: Table 7.
Nova Scotia and Saskatchewan, which had the highest and the third highest
tuition fees in the country in 2003-2004, respectively, were also
the two provinces with the smallest differences in university participation
rates between youth from the lowest and the highest family-income
quartiles. Conversely, Newfoundland and Labrador had the second lowest
tuition fees, but also one of the largest relative gaps in university
participation between the top and bottom income quartiles. The fact
that there was a relatively small difference in university participation
rates between family-income quartiles in Nova Scotia may be partly
explained by the fact that youth there have access to a number of
universities covering a small geographic area.
Finally, Quebec had both the lowest tuition fees and the largest relative
difference in university participation rates between family-income quartiles.
In 2003, Quebec youth from families in the highest income quartile were
more than three times as likely as their peers in the lowest income quartile
to have enrolled at university by age 19. However, as noted earlier, age 19
is considered to be young to have gone to university in Quebec, since most
19 year-olds are still in CÉGEP. Therefore, it may be the case that youth
from the bottom income quartile were taking longer to get to university than
their top income quartile counterparts, rather than not accessing it at all.
Choosing college
Previous research has found that high school graduates from the bottom family-income quartile are almost as likely to go to college as their top family-income quartile counterparts. However, as in the case of the analysis by gender, when youth who are already in university are excluded from the analysis, a different picture emerges in some provinces.
Among non-university bound high school graduates, in Ontario and Newfoundland
and Labrador, youth from the top income quartile were more likely
to go to college than their counterparts from the bottom income quartile
(Table
8). So, for example, in Newfoundland and Labrador, 54.3% of high-income
non-university bound youth had gone to college by 2003, compared to
only 27.3% of low-income youth.
In the rest of the provinces, youth from the bottom income quartile who were
not going to university were just as likely to go to college as their top
income quartile counterparts.
This article confirms previous research on gender and income differences in school pathways. In general, girls and high-income youth are making different choices for their educational pathways. They are more likely to graduate from high school, to participate in postsecondary education, to go to university and, in some provinces, if they are not going to university already, they are more likely to go to college.
This study has found, however, that there are some provincial differences in these patterns.
First, the divide between the genders and between income groups in terms of high school dropout rates varies widely by province. In most provinces, large gaps persist. However, in Saskatchewan, there was no difference in the probability that boys and girls had dropped out of high school by age 19.
Second, among youth who did not pursue university, there was a sizeable gender and income gap related to college participation in some provinces. Specifically, among non-university participants, girls and higher-income youth were more likely to attend college in some provinces.
Third, the advantage held by girls and by youth from higher-income families in terms of university enrolment varied widely by province.
Finally, it was not generally the case that provinces with lower university tuition fees were those in which lower-income youth were doing the best in terms of university participation rates. As well, we see that in Nova Scotia and Saskatchewan, two provinces with relatively higher tuition fees, youth from the bottom income quartile were faring relatively better than their counterparts in other provinces in terms of university participation.
Further research is needed to explain these differences, not only between boys and girls and across income groups, but across provinces as well. Some provinces have made more progress than others in reducing the high school dropout rate for both boys and girls. There is evidence, too, that differences in family income play a smaller role in university participation in some provinces than in others. The key is to understand what programs work best, in which circumstances and for whom.
Notes
-
A report to be published later in 2007 will examine the factors which may account for the gap in university participation between young men and women. See Frenette, Marc and Klarka Zeman (forthcoming). Why Aren’t Young Men in University? Evidence from Academic Abilities, Study Habits and Parental Influences. Analytical Studies Branch Research Paper Series. Ottawa: Statistics Canada.
Frenette, Marc. 2007. Why are Youth from Lower-income Families Less Likely to Attend University? Evidence from Academic Abilities, Parental Influences, and Financial Constraints. Analytical Studies Branch Research Paper Series. Ottawa: Statistics Canada, Catalogue Number 11F0019MIE Number 295. A more detailed report on provincial differences in educational pathways from high school to college and university will be published later in 2007.
Bowlby, Geoff. 2005. Provincial dropout-out rates, trends and consequences. Education Matters. Ottawa: Statistics Canada, Catalogue Number 81-004-XIE - December 2005, volume 2 number 4.
College participation in this article refers to any non-university postsecondary education.
Rahman, Atiq, Jerry Situ and Vicki Jimmo. 2005. Participation in Postsecondary Education: Evidence from the Survey of Labour and Income Dynamics. Statistics Canada and Human Resources and Skills Development Canada, Statistics Canada Catalogue Number 81-595-MIE Number 036.
-
Lambert, Mylène, Klarka Zeman, Mary Allen and
Patrick Bussire. 2004. Who Pursues Postsecondary Education, Who Leaves and Why: Results from the Youth in Transition Survey. Ottawa: Statistics Canada, Catalogue
Number 81-595-MIE2004026.
This method according to: De Broucker, Patrice. 2005. Getting There and Staying There: Low-income Students and Post-secondary Education. Ottawa: Canadian Policy Research Networks. Research Report W27 and Drolet, Marie. 2005. Participation in Post-secondary Education in Canada: Has the Role of Parental Income and Education Changed over the 1990s? Analytical Studies Branch Research Paper Series. Statistics Canada Catalogue No. 11F0019MIE No. 243.
Tables:
Table 1: High school status at age 19, by gender and province, 2003
| |
Male |
Female |
Gra-
duates |
Con-
tinuers |
Lea-
vers |
Gra-
duates |
Con-
tinuers |
Lea-
vers |
| Percent |
| Canada |
84.2 |
6.5 |
* |
9.3 |
|
90.7 |
3.8 |
* |
5.5 |
|
| Newfoundland and Labrador |
86.9 |
3.8 |
1 |
9.3 |
|
93.2 |
2.1 |
2 |
4.7 |
|
| Prince Edward Island |
88.7 |
4.8 |
1 |
6.5 |
1 |
94.8 |
2.6 |
1 |
2.6 |
2 |
| Nova Scotia |
83.0 |
9.7 |
* |
7.3 |
|
90.1 |
4.6 |
* |
5.3 |
|
| New Brunswick |
85.8 |
6.0 |
* |
8.2 |
|
94.5 |
2.3 |
1 * |
3.3 |
1 |
| Quebec |
77.9 |
7.8 |
|
14.4 |
|
86.8 |
5.9 |
|
7.3 |
|
| Ontario |
85.6 |
7.7 |
* |
6.8 |
|
92.3 |
3.1 |
1 * |
4.6 |
1 |
| Manitoba |
84.5 |
4.8 |
1 |
10.6 |
|
89.0 |
3.5 |
1 |
7.5 |
|
| Saskatchewan |
88.8 |
4.4 |
1 |
6.8 |
|
90.9 |
2.5 |
1 |
6.6 |
|
| Alberta |
83.1 |
4.5 |
|
12.4 |
|
88.9 |
4.5 |
|
6.6 |
|
| British Columbia |
90.5 |
3.5 |
1 |
6.0 |
|
93.3 |
2.6 |
1 |
4.1 |
1 |
* Numbers marked with this symbol indicate that the difference between the rates for boys and girls is statistically significant.
1 Numbers marked with this symbol have a coefficient of variation between 16.6% and 25% and are less reliable than unmarked numbers.
2 Numbers marked with this symbol have a coefficient of variation between 25% and 33.3% and are very unreliable.
Source: Statistics Canada. 2003
Youth in Transition Survey (YITS),
Cohort A.
Table 2: Postsecondary participation rates at age 19 for all youth and for high school graduates, by gender and province, 2003
| |
All youth |
High school graduates |
| Male |
Female |
Both sexes |
Male |
Female |
Both sexes |
| Percent |
| Canada |
54.5 |
* |
69.3 |
* |
61.9 |
64.3 |
* |
76.1 |
* |
70.4 |
| Newfoundland and Labrador |
51.7 |
* |
67.3 |
* |
59.9 |
59.4 |
* |
71.9 |
* |
66.2 |
| Prince Edward Island |
59.8 |
|
70.6 |
|
65.5 |
67.2 |
|
74.2 |
* |
71.0 |
| Nova Scotia |
60.8 |
* |
72.0 |
* |
66.5 |
73.1 |
* |
79.9 |
* |
76.7 |
| New Brunswick |
52.8 |
* |
71.3 |
* |
62.6 |
61.3 |
* |
75.3 |
* |
69.1 |
| Quebec |
58.1 |
* |
72.8 |
* |
65.3 |
74.5 |
* |
84.0 |
* |
79.4 |
| Ontario |
57.4 |
* |
74.4 |
* |
66.1 |
66.6 |
* |
80.3 |
* |
73.9 |
| Manitoba |
46.7 |
* |
62.2 |
* |
54.3 |
55.1 |
* |
69.2 |
* |
62.2 |
| Saskatchewan |
44.7 |
* |
58.5 |
* |
51.4 |
50.1 |
* |
64.1 |
* |
57.1 |
| Alberta |
42.2 |
* |
54.6 |
* |
48.2 |
50.3 |
* |
60.2 |
* |
55.2 |
| British Columbia |
54.4 |
* |
63.8 |
* |
59.1 |
59.5 |
* |
68.0 |
* |
63.8 |
* Numbers marked with this symbol indicate that the difference between the rates for boys and girls is statistically significant.
Source: Statistics Canada. 2003 Youth in Transition Survey (YITS), Cohort A.
Table 3: Rates of college participation at age 19, by gender and province, with and without university participants, 2003
| |
All high school graduates |
Non-university participants |
| Male |
Female |
Male |
Female |
| Percent |
| Canada |
35.2 |
34.6 |
49.7 |
|
59.0 |
|
| Newfoundland and Labrador |
25.3 |
20.4 |
38.2 |
|
41.9 |
|
| Prince Edward Island |
19.4 |
15.2 |
37.1 |
|
36.9 |
|
| Nova Scotia |
21.0 |
16.0 |
43.8 |
|
44.2 |
|
| New Brunswick |
22.2 |
19.8 |
36.4 |
|
44.3 |
|
| Quebec1 |
66.2 |
76.8 |
72.5 |
|
81.0 |
|
| Ontario |
32.7 |
29.8 |
49.5 |
* |
60.1 |
* |
| Manitoba |
15.0 |
17.3 |
24.9 |
* |
35.9 |
* |
| Saskatchewan |
17.7 |
19.3 |
26.3 |
|
34.7 |
|
| Alberta |
19.5 |
22.4 |
28.1 |
|
35.9 |
|
| British Columbia |
24.0 |
23.7 |
37.1 |
|
42.5 |
|
| Canada |
35.2 |
34.6 |
49.7 |
|
59.0 |
|
1 In Quebec, college (or CÉGEP) can either be an end in itself
or a prerequisite for university. Thus, youth who are in college because they
are university bound cannot be separated form those who have selected college
as their ultimate postsecondary destination.
* Numbers marked with this symbol indicate that the difference between the rates for boys and girls is statistically significant.
Source: Statistics Canada. 2003
Youth in Transition Survey (YITS),
Cohort A.
Table 4: High school dropout rate at age 19, by
family-income quartile and province, 2003
| |
Quartile 1 |
Quartile 2 |
Quartile 3 |
Quartile 4 |
| Percent |
| Canada |
11.7 |
* |
8.9 |
|
5.6 |
|
3.6 |
* |
| Newfoundland and
Labrador |
12.3 |
|
8.0 |
1 |
4.0 |
2 |
F |
|
| Prince Edward Island |
4.7 |
2 |
7.2 |
1 |
F |
|
F |
|
| Nova Scotia |
11.3 |
|
7.4 |
1 |
6.0 |
1 |
F |
|
| New Brunswick |
9.1 |
1 |
5.6 |
1 |
5.7 |
1 |
F |
|
| Quebec |
17.8 |
* |
14.5 |
|
7.1 |
|
4.7 |
1 * |
| Ontario |
8.3 |
* |
7.2 |
1 |
5.3 |
1 |
2.6 |
2 * |
| Manitoba |
17.2 |
|
9.2 |
1 |
5.7 |
1 |
F |
|
| Saskatchewan |
11.1 |
* |
7.8 |
1 |
5.4 |
1 |
2.9 |
2 * |
| Alberta |
13.5 |
* |
11.0 |
|
6.3 |
1 |
5.2 |
1 * |
| British Columbia |
6.7 |
1 |
7.1 |
1 |
5.0 |
1 |
3.0 |
2 |
* Numbers marked with this symbol indicate that the difference between the rates for boys and girls is statistically significant.
F too unreliable to be published
1 Numbers marked with this symbol have a coefficient of variation between 16.6% and 25% and are less reliable than unmarked numbers.
2 Numbers marked with this symbol have a coefficient of variation between 25% and 33.3% and are very unreliable.
Source: Statistics Canada. 2003 Youth in Transition Survey (YITS), Cohort A.
Table 5: Postsecondary participation rates at age 19, for all youth and for high school graduates, lowest and highest family-income quartiles, by province, 2003
| |
All youth |
High school graduates |
| Lowest family-income quartile |
Highest family-income quartile |
Lowest family-income quartile |
Highest family-income quartile |
| Percent |
| Canada |
50.1 |
72.6 |
61.2 |
77.8 |
| Newfoundland and Labrador |
35.7 |
81.0 |
43.1 |
84.2 |
| Prince Edward Island |
54.6 |
82.1 |
59.3 |
84.4 |
| Nova Scotia |
51.3 |
79.9 |
66.4 |
83.9 |
| New Brunswick |
46.3 |
76.2 |
55.8 |
79.7 |
| Quebec |
51.6 |
77.9 |
70.7 |
86.7 |
| Ontario |
55.4 |
77.2 |
65.4 |
81.6 |
| Manitoba |
37.0 |
67.9 |
47.9 |
70.8 |
| Saskatchewan |
43.0 |
60.4 |
51.9 |
63.4 |
| Alberta |
37.0 |
60.0 |
44.4 |
65.8 |
| British Columbia |
47.4 |
67.1 |
52.7 |
69.8 |
Source: Statistics Canada. 2003 Youth in Transition Survey (YITS), Cohort A.
Table 6: Average undergraduate tuition fees, 2003-2004
| |
Average undergraduate tuition fees |
| Current Dollars |
| Nova Scotia |
5,557 |
| Ontario |
4,923 |
| Saskatchewan |
4,644 |
| Alberta |
4,487 |
| New Brunswick |
4,457 |
| British Columbia |
4,140 |
| Prince Edward Island |
4,133 |
| Manitoba |
3,155 |
| Newfoundland and
Labrador |
2,606 |
| Quebec |
1,862 |
Source: Tuition and Living Accommodation Costs for Full-time Students at Canadian Degree-granting Institutions Survey, 2003-2004.
Table 7: University participation rates at age 19 of high school graduates, by family-income quartile and province, 2003
| |
Quartile 1 |
Quartile 2 |
Quartile 3 |
Quartile 4 |
| Percent |
| Canada |
25.4 |
29.3 |
37.7 |
46.4 |
| Newfoundland and
Labrador |
21.7 |
35.2 |
46.0 |
65.0 |
| Prince Edward Island |
35.9 |
44.4 |
58.4 |
75.3 |
| Nova Scotia |
44.9 |
48.6 |
59.0 |
74.2 |
| New Brunswick |
30.8 |
44.5 |
49.8 |
65.7 |
| Quebec1 |
6.9 |
9.7 |
10.8 |
21.1 |
| Ontario |
32.2 |
34.4 |
47.2 |
53.7 |
| Manitoba |
27.7 |
43.5 |
47.3 |
56.1 |
| Saskatchewan |
32.0 |
31.7 |
39.6 |
48.1 |
| Alberta |
24.6 |
29.7 |
33.5 |
44.2 |
| British Columbia |
30.1 |
35.0 |
42.5 |
47.6 |
1 In Quebec, where youth typically first attend CÉGEP before university,
very few youth had reached university by age 19; as a consequence, the
university participation rate in Quebec was considerably lower than the national
average.
Source: Statistics Canada. 2003 Youth in Transition Survey (YITS), Cohort A.
Table 8: College participation rates at age 19, with and without university participants, lowest and highest family-income quartiles, by province, 2003
| |
All high school graduates |
Non-university participants |
| Lowest family-income quartile |
Highest family-income quartile |
Lowest family-income quartile |
Highest family-income quartile |
| Percent |
| Canada |
35.8 |
|
31.4 |
|
47.9 |
* |
58.6 |
* |
| Newfoundland and Labrador |
21.4 |
|
19.0 |
|
27.3 |
* |
54.3 |
* |
| Prince Edward Island |
23.3 |
* |
9.1 |
1 * |
36.3 |
|
36.8 |
|
| Nova Scotia |
21.5 |
* |
9.6 |
1 * |
39.0 |
|
37.1 |
|
| New Brunswick |
24.7 |
* |
14.0 |
* |
35.7 |
|
40.8 |
|
| Quebec2 |
64.0 |
|
65.9 |
|
68.9 |
|
83.5 |
|
| Ontario |
33.2 |
|
27.9 |
|
48.9 |
* |
60.3 |
* |
| Manitoba |
19.6 |
|
14.6 |
|
27.1 |
|
33.3 |
|
| Saskatchewan |
20.0 |
|
15.0 |
|
29.4 |
|
29.0 |
|
| Alberta |
19.6 |
|
21.5 |
|
26.0 |
|
38.5 |
|
| British Columbia |
22.6 |
|
21.8 |
|
32.3 |
|
41.7 |
|
* Numbers marked with this symbol indicate that the difference between the rates for youth from family-income quartiles 1 and 4 is statistically significant.
1Numbers marked with this symbol have a coefficient of variation between 16.6% and 25% and are less reliable than unmarked numbers.
2 In Quebec, youth typically enter the CÉGEP system
immediately following high school. In CÉGEP, youth may pursue a program
which is the prerequisite for university and which is normally completed in
two to three years or they could pursue a college-level program, typically
a three-year program, as an end in itself. As a result, the college-participation
rate in Quebec tends to be much higher than in other provinces.
Source: Statistics Canada. 2003 Youth in Transition Survey (YITS), Cohort A.
|

