
Statistics Canada
www.statcan.gc.ca
Common menu bar links

Archived Content
Information identified as archived is provided for reference, research or recordkeeping purposes. It is not subject to the Government of Canada Web Standards and has not been altered or updated since it was archived. Please "contact us" to request a format other than those available.
Completion and discontinuation rates of registered apprentices: Does program duration matter?
Louise Desjardins
Statistics Canada
Six apprentices out of ten were registered in a program with a nominal duration of four years
Pathways of apprentices during the 11-year period
Program duration did not seem to influence completion rates
Completers took a median time of five years to finish their training
Status of apprenticeship over the 11-year period
Conclusion
According to the Labour Force Survey (LFS), workers aged 55 years and over accounted for close to 15% of Canadians in the labour market in 2007, an increase of five percentage points compared to 1987, when their share was about 10%. Meanwhile, the proportion of workers aged 25 to 34 decreased by nine percentage points, falling from 30% in 1987 to 21% in 2007.1 Fewer people entering the labour market compared to those leaving it contributed to the aging-worker phenomenon seen in most sectors of the Canadian economy.
The skilled trades are not exempt from this pattern. Between 1987 and 2007, the average age of tradespersons in Canada rose from 36 to 40 years. Moreover, the ratio of the number of workers aged 25 to 34 to the number of workers nearing retirement dropped from 2.0 to 1.0 over the period.2
This article summarizes the results of a recent Statistics Canada study that examined completion and discontinuation rates of registered apprentices over a period of 11 years - from 1995 to 2005 - using a longitudinal cohort created from the Registered Apprenticeship Information System (RAIS).3 This cohort comprised registered apprentices who first enrolled in an apprenticeship program in 1995 in six provinces: New Brunswick, Québec, Ontario, Manitoba, Alberta and British Columbia.4
Since the nominal duration of most apprenticeship programs varies between two and five years, apprenticeship training can represent an important time investment. This article examines the relationship between the duration of an apprenticeship program and completion and discontinuation rates. Completion and discontinuation are discussed in relation to the nominal duration of programs, the median time needed for completion, as well as time spent in the program for discontinuers.
Six apprentices out of ten were registered in a program with a nominal duration of four years
In 1995, 29,501 persons began a new apprenticeship program in the six provinces covered by the cohort analysis. Overall, 45% of new apprentices were registered in either the motor vehicle and heavy equipment group (23%) or the metal fabricating group (22%), while the industrial and mechanical trades group received the fewest new apprentices, namely 8%. Two of the trades with the highest proportions of new registrations across the six provinces were automotive service technician (2,937 new apprentices) and construction electrician (2608 apprentices).
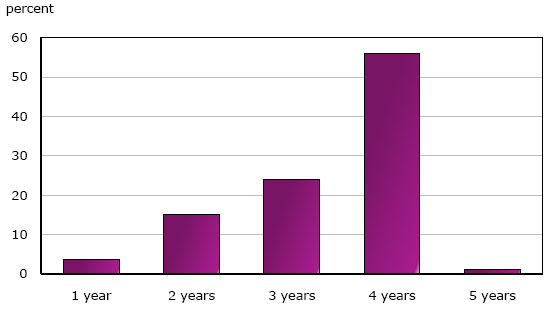
More than half (56%) of the apprentices in the 1995 to 2005 cohort were registered in four-year programs. One quarter of apprentices were registered in three-year programs (24%), while two-year programs accounted for 15% of new apprentices. Very few apprentices (1% and 4%) were registered in programs of either one year or five years in duration (Chart 1).
Chart 1
Registrations by program duration, 1995 cohort
Source: Statistics Canada, Registered Apprenticeship Information System.
The median age of new apprentices in the 1995 cohort was 25 years, meaning that half of them were over the age of 25 and half were less than 25 when they registered in their apprenticeship program. The median age at registration was practically the same for programs of two-year, three-year and four-year durations, ranging from 24 to 26 years old.
The apprentices’ relatively high age at registration compared to other postsecondary students at college or university may be explained by the fact that the clientele of apprenticeship programs consists primarily of persons coming back into the education system after a few years in the labour force.5 According to the National Apprenticeship Survey (NAS) conducted in 2007, three apprentices out of five already had practical experience in the trade when they registered in an apprenticeship program.6
Pathways of apprentices during the 11-year period
About half the persons newly registered in an apprenticeship program in 1995 (51%) had completed their training program at the end of the 11-year period, in 2005.
Slightly more than four apprentices out of ten (42%) never completed a program (discontinuers) and some 8% were still registered at the end of the 11-year period, having neither completed nor discontinued a program (continuers) (Table 1).
Table 1
Proportion of completers, discontinuers and continuers at the end of the 11-year period, 1995 cohort
| Program duration | Completers | Discontinuers | Continuers |
|---|---|---|---|
| percent | |||
| All programs1 | 51 | 42 | 8 |
| 2-year programs | 55 | 35 | 10 |
| 3-year programs | 44 | 48 | 9 |
| 4-year programs | 54 | 40 | 6 |
|
1. Includes 1-year and 5-year programs. Note: Given the small number of apprentices registered in one-year and five-year programs, comparisons with programs of two, three and four years in duration are not advisable; therefore one and five-year programs are not included in the table. Source: Statistics Canada, Registered Apprenticeship Information System. |
|||
Program duration did not seem to influence completion rates
The nominal program duration did not seem to influence the completion rate. Overall, the proportion of completers of four-year programs was comparable to that for two-year programs. Moreover, this proportion surpassed the global completion rate by three percentage points and even exceeded the proportion of completers in three-year programs by ten percentage points.
Four-year programs posted higher proportions of completers than programs of shorter duration in four major trade groups out of six: industrial and mechanical trades (63%), motor vehicle and heavy equipment (60%), electrical, electronics and related trades (53%) and building construction trades (36%).
Conversely, in the food and service trades group, apprentices in two-year programs showed the highest completion rate (65%), while this was the case for apprentices in three-year programs in the metal fabricating trades group (63%) (Chart 2).
Chart 2
Percentage of completers by nominal program duration in number of years and major trade group, 1995 cohort
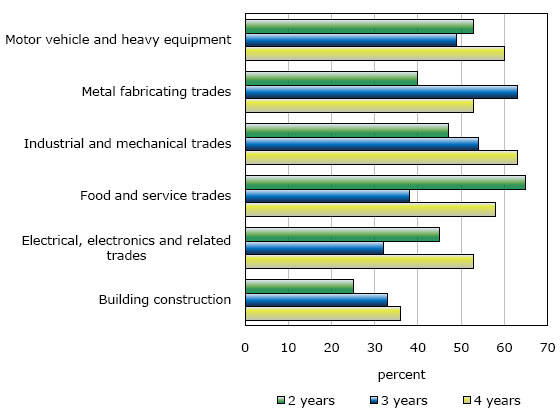
Note: Given the small number of apprentices registered in one-year and five-year programs, comparisons with programs of two, three and four years in duration are not advisable; therefore one and five-year programs are not included in the chart.
Source: Statistics Canada, Registered Apprenticeship Information System.
The fact that a specific trade is covered by the Red Seal Interprovincial Standards Program may partly explain these results. The standardization of training programs, training outcomes, examinations and the awarding of certificates as well as closer matches between the skills of apprentices and the needs of the labour market in Red Seal-designated trades may contribute to higher completion rates. Also, an additional incentive to complete the program in a Red Seal trade is the ability to work anywhere in Canada, not just in the province where the apprenticeship was completed.
Overall, more than nine four-year programs out of ten (93%) were Red Seal-designated trades. Almost all four-year programs in the electrical, electronics and related trades group (98%) and the motor vehicle and heavy equipment trades group (98%) were covered by the Red Seal Interprovincial Standards Program. Four-year programs in the industrial and mechanical trades groups (93%) and building construction trades group (90%) closely followed. Conversely, all four-year programs in the food and service groups were non-Red Seal trades, while three-year programs in the metal fabricating trades group posted the highest proportions of Red Seal designated trades (95%).
Completion and discontinuation rates were calculated for trades which had at least 500 new registrants in 1995. These trades, 15 in all and representing about 70% of all apprentices, are shown in Table 2 in descending order of completion rates. A glance at the table shows that apprentices in four-year programs were at least as likely to complete their training as apprentices in programs of two-year or three-year duration. Indeed, four out six programs with completion rates above 60% had a nominal duration of four years. These four programs are: refrigeration and air conditioning mechanics, which posted the highest completion rate, at 67%, followed by the heavy duty equipment mechanic technician (66%), the industrial mechanic-millwright (63%) and construction electrician (62%) trades. Among the programs of shorter duration which posted completion rates above 60% were hairdresser / hairstylist (66%) and welder (62%); the nominal duration of these two programs were two years and three years, respectively.
Table 2
Proportion of completers, discontinuers and program duration for specific trades, 1995 cohort
| Trades | Completers | Discontinuers | Nominal duration of program | Median duration for completers | Median time spent in program, discontinuers |
|---|---|---|---|---|---|
| percent | years | ||||
| Refrigeration and air conditioning mechanic | 67 | 28 | 4 | 5.0 | 4.0 |
| Heavy duty equipment mechanic technician | 66 | 30 | 4 | 5.0 | 4.0 |
| Hairdresser / hairstylist | 66 | 28 | 2 | 2.0 | 3.0 |
| Industrial mechanic-millwright | 63 | 27 | 4 | 5.0 | 4.0 |
| Construction electrician | 62 | 33 | 4 | 5.0 | 4.0 |
| Welder | 62 | 35 | 3 | 4.0 | 4.0 |
| Automotive service technician | 59 | 37 | 4 | 5.0 | 4.0 |
| Plumber | 58 | 37 | 4 | 5.0 | 3.0 |
| Machinist | 56 | 35 | 4 | 5.0 | 3.0 |
| Sheet metal worker | 54 | 38 | 4 | 5.0 | 4.0 |
| Motor vehicle body repairer | 41 | 49 | 3 | 5.0 | 4.0 |
| Steamfitter-pipefitter | 38 | 58 | 4 | 5.0 | 4.0 |
| Cook | 37 | 55 | 3 | 4.0 | 4.0 |
| Carpenter | 34 | 57 | 4 | 5.0 | 3.0 |
| Industrial electrician | 23 | 70 | 4 | 5.0 | 4.0 |
| All trades | 51 | 42 | ... | 5.0 | 4.0 |
| Note: Data are listed in descending order of the proportion for completers. Source: Statistics Canada, Registered Apprenticeship Information System. |
|||||
Completers took a median time of five years to finish their training
Overall, the median time that apprentices needed to complete their program was five years. This is also true for 12 of the 15 trades posted in Table 2. Furthermore, when the nominal duration of programs is compared to the median amount of time needed by completers, it becomes clear that in the majority of cases, the median duration exceeded the nominal duration by only one year. There were two exceptions to this: completers in the motor vehicle body repairer trade took two years beyond the nominal duration to complete, namely five years rather than three, while completers in the hairdresser / hairstylist trade finished their program within the prescribed duration, that is, two years.
Furthermore, the median time spent in the program for all discontinuers was four years, one year less than the time taken by completers to finish their program. Discontinuers spent one year less in their program than completers in most trades shown in Table 2.
Discontinuers were generally older than completers at the time of registration. Indeed, the median age of discontinuers was three years older than that of completers: 27 years compared to 24. The same age gap existed between completers and discontinuers in programs with a three-year nominal duration, while there was a difference of two years in age between completers and discontinuers in programs of two-year and four-year durations (Table 3).
Table 3
Median age at registration of completers and discontinuers by nominal duration of program, 1995 cohort
| Program duration | Completers | Discontinuers |
|---|---|---|
| years | ||
| All programs1 | 24.0 | 27.0 |
| 2-year programs | 24.0 | 26.0 |
| 3-year programs | 25.0 | 28.0 |
| 4-year programs | 24.0 | 26.0 |
| 1. Includes 1-year and 5-year programs. Source: Statistics Canada, Registered Apprenticeship Information System. |
||
The Registered Apprenticeship Information System (RAIS) does not provide the reasons why some apprentices do not complete their apprenticeship programs. Since discontinuers in the 1995 cohort spent a median time of four years in their program, and since this corresponded to the period of strong economic growth of the years 1998 to 2000, it seems unlikely that leaving the program was related to a lack of work. On the contrary, employment growth in Canada was at least 2.5% annually from 1998 to 2000.7 Many discontinuers may have left with significant skill sets and might have been productive trade workers in certain workplaces.
Status of apprenticeship over the 11-year period
Chart 3 shows the cumulative proportions of completers, discontinuers and continuers for the 1995 cohort of apprentices during the 11-year period. At the end of the second year, the proportion of discontinuers (14%) was almost three times higher than the proportion of completers (5%). During the following two years (1997 and 1998), the rates of discontinuation rose more rapidly that the rates of completion. The progression in discontinuation rates then began to wane, reaching a plateau of 39% in 2002 and 2003 and culminating at 42% during the final two years of the study period. Meanwhile, between the fourth and fifth years of training (which correspond to the median duration for completion), the proportion of completers rose by 14 percentage points, exceeding the proportion of discontinuers by the end of the fifth year (38% compared to 33 %). During the subsequent years, the completion rate increased more rapidly than the rate of discontinuation, at 13 percentage points compared to 9 percentage points, reaching 51% and 42%, respectively, in 2005.
Chart 3
Learning status of registered apprentices over an 11-year period, 1995 cohort
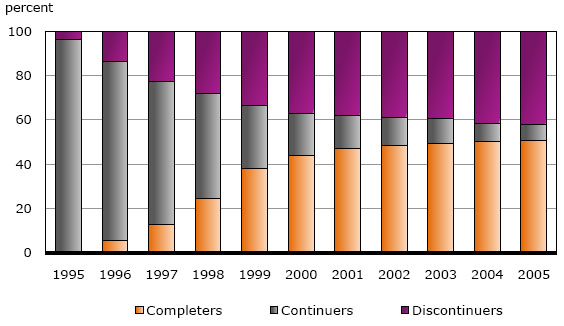
Source: Statistics Canada, Registered Apprenticeship Information System.
Conclusion
A highly-qualified workforce and a sufficient supply of workers in the skilled trades are two essential prerequisites for ensuring that Canada’s trades sector remains highly competitive and continues to contribute to the country’s economic growth. Apprenticeship is one of the most important mechanisms to achieve these two objectives. Accordingly, the completion rates and completion patterns of apprentices are two research areas of importance for apprenticeship stakeholders.
Half of the 29,501 persons newly registered in an apprenticeship program in 1995 completed their program at the end of the 11-year study period, in 2005. The nominal program duration did not seem to influence the completion rate: apprentices in four-year programs were as likely to finish their program as apprentices in programs of shorter duration, such as two-year or three-year programs. Completers took a median time of five years to complete their apprenticeship program while discontinuers spent a median time of four years in their program before leaving.
Overall, the median duration needed by completers exceeded the program nominal duration by only one year.
Notes
-
Statistics Canada. Table 282-0002: Labour Force Survey estimates (LFS), by sex and detailed age group, annual, CANSIM (database). (site consulted on May 11th, 2010).
-
Pyper, Wendy. 2008. “Skilled trades employment”, Perspectives on Labour and Income, vol. 9, no 10, Statistics Canada Catalogue no. 75-001-X.
-
Desjardins, Louise et Nicole Paquin. 2010. Registered Apprentices: the Cohorts of 1994 and 1995, One Decade Later, Statistics Canada Catalogue no. 81-595-M No. 080. The report provides information on the characteristics of those newly registered in an apprenticeship program in 1994 and in 1995. It analyzes completion rates and the time needed to complete the programs; discontinuation rates and time spent in a program before leaving the program; and finally, continuation rates at the end of the 11-year study period. Detailed information is provided by trade for six provinces: New Brunswick, Québec, Ontario, Manitoba, Alberta and British Columbia.
-
Only provinces that could provide individual data for all years between 1995 and 2005 were included in the cohort.
-
O’Grady, John. 1997. Apprenticeship in Canada: Issues and Problems, based on remarks to the Annual Conference of Vocational and Technical Education of the Canadian Vocational Association, York University, October 18, 1997, 6 p.
-
Ménard, Marinka, Frank Menezes, Cindy K.Y. Chan and Merv Waler. 2007. National Apprenticeship Survey: Canada Overview Report 2007, Statistics Canada Catalogue no. 81-598X, Ottawa, 88 p.
-
Statistics Canada. Table 282-0002: Labour Force Survey (LFS), by sex and detailed age group, annual, CANSIM (database). (site accessed on February 25, 2009).