A Changing Portrait of International Students in Canadian Universities

Archived Content
Information identified as archived is provided for reference, research or recordkeeping purposes. It is not subject to the Government of Canada Web Standards and has not been altered or updated since it was archived. Please "contact us" to request a format other than those available.
Kathryn McMullen and Angelo Elias
Tourism and the Centre for Education Statistics Division
Statistics Canada
Overall trends in the shares of international students, Canada and provinces
Changes in the composition of international students, by level of university education
The changing age and gender characteristics of international students
Region of origin of international students
Canadian region of destination of international students
Changes in field of study
Conclusion
International students have been part of Canadian university campuses for many years. And their numbers have been increasing. Along with that growth has come change in the characteristics of those students, changes that are evident in their university program levels and fields of study, age and gender composition, source countries and destinations within Canada.
This article uses data from the Postsecondary Student Information System (PSIS) to draw a portrait of the changing make-up of international students enrolled in Canadian universities on either a part-time or full-time basis over the 1992 to 2008 period. This changing portrait shows how different international students are today compared to their counterparts in the early 1990s.
Overall trends in the shares of international students, Canada and provinces
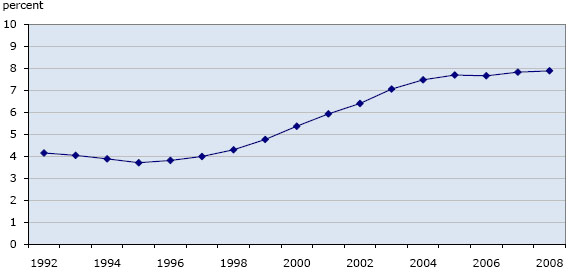
In 1992, international students accounted for about 4% of all students enrolled in Canadian universities (Chart 1). That share fell very slightly in the mid-1990s before showing steady growth through to the mid-2000s. By 2008, the share of international students had doubled compared to 1992, reaching 8% of all university students in Canada. These changes are the result of an increase in the overall number of international students at Canadian universities from 36,822 in 1992 to 87,798 in 2008.
Chart 1
International students as a proportion of all university enrolments, Canada, 1992 to 2008
Source: Statistics Canada, Postsecondary Student Information System (PSIS).
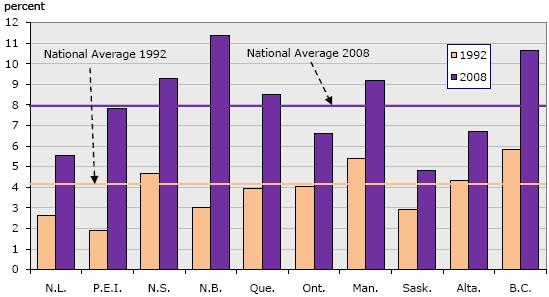
The gains in the shares of international students have not been even across provinces. Notably large increases are evident in New Brunswick, which saw the percentage of international students rise from among the lowest in 1992, at 3%, to one of the highest in 2008, at 11.4% (Chart 2). International students also accounted for a relatively large share of university students in 2008 in British Columbia, Nova Scotia and Manitoba, at 10.6% and 9.3% and 9.2%, respectively. Strong gains in the shares of percentages of international students are also evident over this period in Prince Edward Island and Nova Scotia.
Chart 2
International students as a proportion of all university enrolments, by province, 1992 and 2008
Source: Statistics Canada, Postsecondary Student Information System (PSIS).
It should be noted that, in some provinces, even though the share of international students showed relatively large increases, their overall numbers remained comparatively small. For example, in New Brunswick, the number of international students rose from 747 in 1992 to 2,616 in 2008. Also, large increases in the number of international students can be masked by large increases in the total number of students. In British Columbia, for instance, the number of international students rose from 3,858 in 1992 to 16,662 in 2008, while over the same period, the total number of students rose from 66,171 to 156,741.
Changes in the composition of international students, by level of university education
Accompanying the rise in the share of international students at Canadian universities has been a shift in the level of studies in which they are enrolled.
Most notable is a decrease in the share of international students enrolled in programs at the doctorate level and an increase in the share enrolled at the bachelor's level. Overall, 12% of international students were enrolled in doctoral programs in 2008, compared to 19% in 1992; similarly, the shares enrolled in master's programs decreased from 23% in 1992 to 18% in 2008 (Chart 3). In contrast, the shares enrolled in bachelor's level programs rose from 55% in 1992 to 67% in 2008.
Chart 3
International students as a proportion of all university enrolments,1 by level of education, Canada, 1992 to 2008
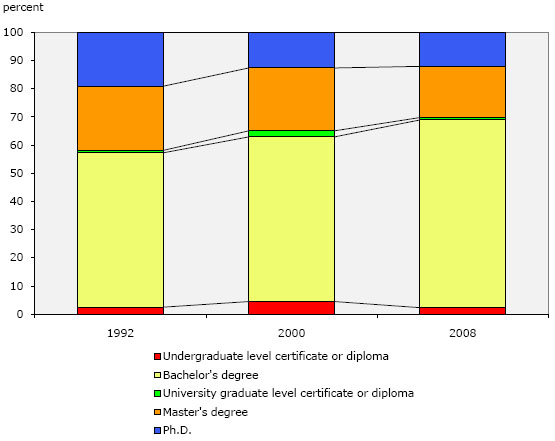
1
Excludes enrolments in qualifying and residency programs as well as programs normally associated with colleges but offered in universities.
Source: Statistics Canada, Postsecondary Student Information System (PSIS).
This shift toward a greater proportion of international students enrolling in a first degree program is masked by the overall numbers of students at the undergraduate level. For example, in 1992, international students accounted for 3.1% of students enrolled at the bachelor's level, Canada-wide; by 2008, this percentage had risen to 6.6%. International students continue to account for a much larger – though declining – share of students at the doctorate level, at 24.9% of students in 1992 and 20.6% in 2008. Relatively little change is evident at the master's level, with the share of international students being 10.5% in 1992 and 12.8% in 2008.
The changing age and gender characteristics of international students
The shift to a growing number of international students enrolling at the bachelor's level is reflected in changes in their age and gender composition. Most notably, they have become younger.
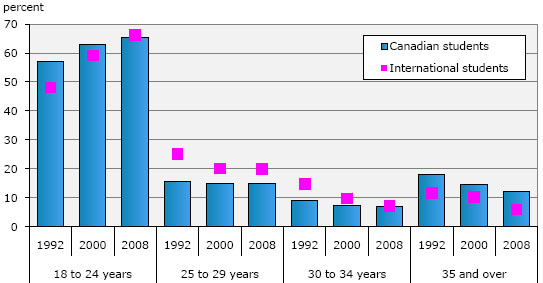
As shown in Chart 4, 18 to 24 year-olds accounted for a smaller share of international students in 1992, at 48%, than was the case for Canadian students, at 57%. Instead, international students were more likely than Canadian students to be 25 to 29 years old and 30 to 34 years old in 1992.
These age profiles changed over time. Most notably, there has been a convergence between international and Canadian students among the younger age group, with 18 to 24 year-olds accounting for about two thirds of both groups in 2008. In both cases as well, this convergence also reflects the fact that 18 to 24 year-olds accounted for a larger share of students in 2008 compared to 1992. Convergence is evident as well in the share of students accounted for by 30 to 34 year-olds, with this share decreasing for both groups. At the other end of the scale, consistently larger shares of Canadian students have been aged 35 years or more compared to their international counterparts, though in both cases, that share has decreased slightly over time.
Chart 4
Age profile of international students compared to Canadian students, Canada, 1992, 2000 and 2008
Source: Statistics Canada, Postsecondary Student Information System (PSIS).
The change is less dramatic on the gender front, but change is evident, nonetheless. Overall in Canada, females have accounted for well over half of university students since the beginning of the PSIS time series in 1992. There has been an increase in the female share of international students as well, though males continue to account for more than half. In 1992, about 39% of international students were female. That share rose steadily through the 1990s, reaching 45% in 1999, with the share holding more or less steady through to 2008.
In terms of level of university studies, the female share of enrolment at the undergraduate level remained steady over the period, with females accounting for 45% of international students at the bachelor's level in 1992 and for 48% in 2008. More notable shifts are evident at the graduate level, with those shifts largely taking place in the 1990s. The female share of international students enrolled in master's degree programs rose from 35% in 1992 to 41% in both 2000 and 2008. An even larger increase is observed at the doctorate level, with the female share rising from about one-quarter in 1992 to over one-third in 2000 and 2008.
Region of origin of international students
While there have been some shifts over time in the region of origin of international students, the picture in 2008 was very similar to that in 1992. Asian students have consistently accounted for the largest share of international students, though that share dipped in the late 1990s. In 1992, students from Asia accounted for 49.8% of international students. That share fell to 36.5% in 1999, then rose steadily to reach 52.7% in 2008.
The next largest group consists of students from Europe, with their share being 16.3% in 1992, rising to 24.9% in 1998, then falling to 17.9% in 2008. In contrast, students originating from countries in Africa have accounted for a declining share of international students, falling from 17.1% in 1992 to 11.8% in 2008.
Canadian region of destination of international students
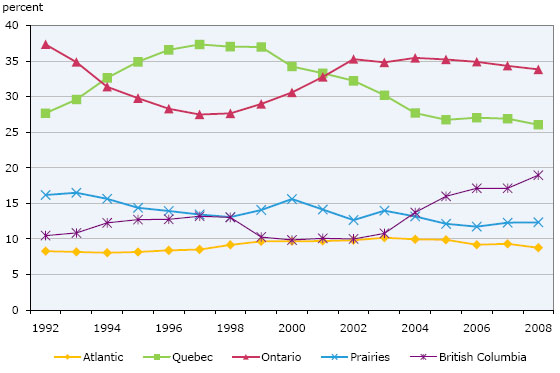
With respect to the Canadian region of destination of international students, the largest shifts are observed in the provinces of Quebec and Ontario. Quebec's share of international students rose from 27.7% in 1992 to 37% in the 1997 to 1999 period, falling thereafter to 26.1% in 2008. The pattern was reversed in Ontario, with Ontario universities accounting for 37% of international students in 1992 with that share falling to 27.5% in 1998, then rising again in the early 2000s. In 2008, this share was 33.8%.
Change is clearly evident in British Columbia as well, which saw its share of international students almost double, rising from 10.5% in 1992 to 19.0% in 2008.
Chart 5
Region of destination, international students, Canada, 1992 to 2008
Source: Statistics Canada, Postsecondary Student Information System (PSIS).
Changes in field of study
Not only has the demographic profile of international students changed over time, so too have the fields of study they are pursuing while attending Canadian universities. Furthermore, those changes in fields of study have been larger than in the case of Canadian students.
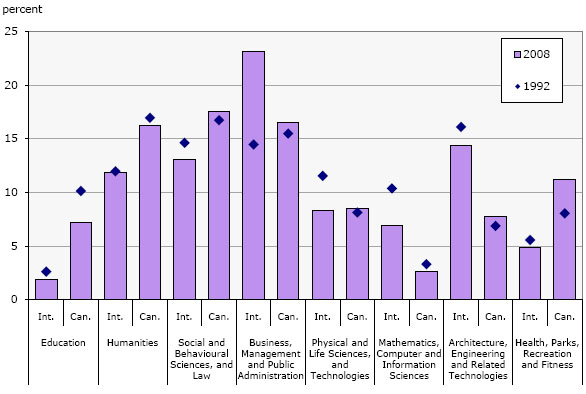
Chart 6 shows the distribution of both international and Canadian university students in 1992 and 2008, by field of study. That chart shows, for example, that the share of international students who were enrolled in "education" changed little in 2008 compared to 1992, with about 2% of international students being enrolled in that field of study in both years. In comparison, the share of Canadian students who were enrolled in "education" decreased slightly, from 10.1% in 1992 to 7.2% in 2008.
Looking first at international students, the largest shifts were away from "mathematics, computer and information sciences" (10.4% in 1992 and 6.9% in 2008) and the "physical and life sciences, and technologies" (11.5% in 1992 and 8.3% in 2008). The largest gain was in "business, management and public administration," which accounted for 14.5% of international students in 1992 and for 23.2% in 2008. Such a shift toward larger percentages of students enroling in "business, management and public administration" is not evident for Canadian students, with that share being 15.5% and 16.5% in 1992 and 2008, respectively.
While there has been no real change over time, it is worth noting that "architecture, engineering and related technologies" accounted for much larger shares of international students in both 1992 and 2008 compared to their Canadian counterparts. In 1992, for example, 16.1% of international students were enrolled in this field of study and that share was relatively similar in 2008, at 14.4%. In contrast, "architecture, engineering and related technologies" accounted for 6.9% of Canadian students in 1992 and for 7.7% in 2008.
Chart 6
Distribution of international and Canadian students, by field of study, Canada, 1992 and 2008
Source: Statistics Canada, Postsecondary Student Information System (PSIS).
Conclusion
Overall, the share of enrolment at Canadian universities accounted for by international students doubled between 1992 and 2008, rising from 4% to 8%. That being said, some provinces have seen larger increases in their international student populations than others. This is especially the case for New Brunswick, Prince Edward Island and Nova Scotia. Strong gains are evident as well in Ontario, which accounted for well over one-third of international students in 2008, and in British Columbia, which saw its share of international students almost double, rising from 10.5% in 1992 to 19.0% in 2008.
While there have been some shifts over time in the region of origin of international students, the picture in 2008 was very similar to that in 1992. Asian students have consistently accounted for the largest share of international students – 49.8% in 1992 and 52.7% in 2008. The largest change has been a significant decrease in the share of international students originating from countries in Africa.
More notable are changes in the characteristics of international students over time. Compared to their counterparts in 1992, those in 2008 were younger and more likely to be enrolled in programs at the bachelor's level than in doctorate programs. Less change is evident in the case of their gender make-up, with the share of females rising from 39% in 1992 to 45% in 1999 and holding steady at that share since.
Last, significant change is evident in the fields of study in which international students are enrolled. Notably, smaller shares of them were enrolled in "mathematics, computer and information sciences" and the "physical and life sciences, and technologies" in 2008 compared to 1992, with strong gains being evident in the share of enrolment found in "business, management and public administration."
- Date modified: