Public School Indicators for Canada, the Provinces and Territories, 2000/2001 to 2008/2009

Archived Content
Information identified as archived is provided for reference, research or recordkeeping purposes. It is not subject to the Government of Canada Web Standards and has not been altered or updated since it was archived. Please "contact us" to request a format other than those available.
Kathryn McMullen and Riley Brockington
Tourism and the Centre for Education Statistics Division
Statistics Canada
Enrolment and demographic change
Graduates
Second-language immersion and minority-language enrolment
Aboriginal language as a course of instruction
Educators
Student-educator ratio
Conclusion
The public education system across Canada continues to make significant progress as it balances the need to educate children in a highly competitive and globalized society with the challenges associated with the management of large and diverse institutional systems.
Among those challenges is the need to adjust to changes in the size and geographical distribution of the school-aged population. Just under 5.1 million students were enroled in publicly-funded elementary and secondary schools in Canada during the 2008/2009 academic year. This was the lowest level since 1998/1999 when data for the Elementary-Secondary Education Survey were first collected. Enrolment peaked at nearly 5.4 million students in 2001/2002. Other challenges include meeting the demand for second-language education; addressing emerging needs such as that presented by the relatively large and growing Aboriginal population, especially in the western provinces; and the need to employ sufficient staff to deliver the myriad educational services demanded by a diverse school-aged population.
This article uses data from the most recent Elementary-Secondary Education Survey to examine broad trends in enrolment and educators in publicly-funded elementary and secondary schools over the 2000/2001 to 2008/2009 period, by province and territory.
Enrolment and demographic change
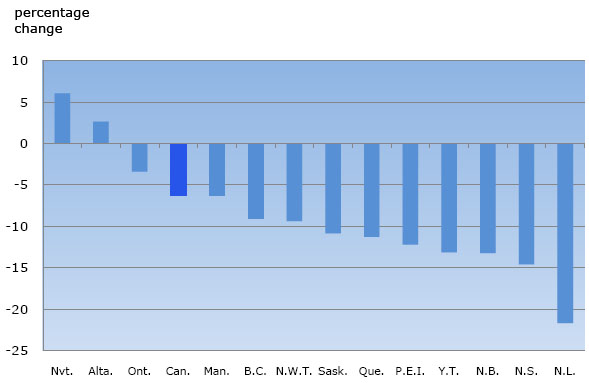
Enrolment in publicly-funded elementary and secondary schools decreased across Canada between 2000/2001 and 2008/2009. In the academic year 2008/2009, enrolment stood at just under 5.1 million students, down 5% since 2000/2001.
With the exceptions of Alberta and Nunavut, all provinces and territories saw enrolment decreases over the 2000/2001 to 2008/2009 period, The largest decrease is evident in Newfoundland and Labrador, which saw a 22% decrease in the number of students enroled in publicly-funded elementary and secondary schools over that period (Chart 1). Relatively large decreases in enrolment are also evident in the other Atlantic provinces, with decreases of 15% observed in Nova Scotia, 13% in New Brunswick and 12% in Prince Edward Island. Quebec, Saskatchewan and Yukon also saw enrolment decreases of 4%, 10% and 13%, respectively.
In contrast, enrolments increased by 6% in Nunavut and by 3% in Alberta over the same period.
Chart 1
Percentage change in elementary/secondary enrolments (headcount) in publicly-funded elementary and secondary schools, Canada, provinces and territories, 2000/2001 to 2008/2009
Source: Statistics Canada. Elementary-Secondary Education Survey.
These trends are consistent with data on changes in the size of the school-aged population over this period. For example, between July 1, 2001 and July 1, 2009, the number of 5 to 19 year-olds decreased by 19% in Newfoundland and Labrador, 15% in Nova Scotia, 14% in New Brunswick, and 12% in Prince Edward Island. Lower birth rates and migration to other parts of Canada are two of the main reasons for these decreases in the size of the school-aged population.
Graduates
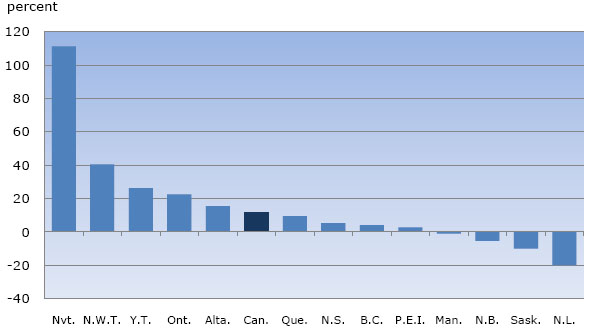
The number of graduates obtaining a secondary school diploma continued to increase in 2008/2009 with 341,700 diplomas issued across Canada. This is an 11.9% increase from 2000/2001 when 305,400 diplomas were issued. A larger cohort of older students making its way through the school system, as well as various provincial initiatives aimed at keeping students in school until they graduate, have contributed to these gains.
Eight provinces and territories recorded an increase in the number of graduates between 2000/2001 and 2008/2009 (Chart 2). Relatively large gains in Nunavut, Northwest Territories and Yukon reflect small underlying numbers of graduates. Gains above the national average are also evident in Ontario (22% increase) and in Alberta (15% increase). In contrast, the number of graduates decreased by 20% over this period in Newfoundland and Labrador, by 10% in Saskatchewan and by 5% in New Brunswick.
Chart 2
Percentage change in number of graduates, publicly-funded secondary schools, Canada, provinces and territories, 2000/2001 to 2008/2009
Source: Statistics Canada. Elementary-Secondary Education Survey.
Second-language immersion and minority-language enrolment
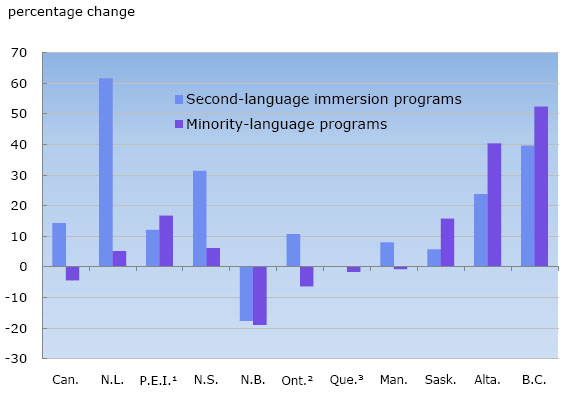
Contrary to the trends in total school enrolment across Canada, enrolment in second-language immersion programs in publicly-funded elementary and secondary schools has increased over time. In 2008/2009, about 317,000 students were enroled in a second-language immersion program, an increase of 14% over 2000/2001 (Chart 3).
Over this period, the number of students enroled in second-language immersion programs increased by 62% in Newfoundland and Labrador, 40% in British Columbia, 31% in Nova Scotia and 24% in Alberta. In contrast, the number of students enroled in second-language immersion programs decreased by 18% in New Brunswick. Overall, Ontario accounted for the largest number of second-language immersion students in 2008/2009, when enrolment stood at over at 167,000.
Chart 3
Percentage change between 2000/2001 and 2008/2009 in enrolments in second-language immersion and minority-language programs in publicly-funded elementary and secondary schools, Canada and provinces
1 2001/2002 to 2008/2009.
2 Includes French immersion and extended French programs.
3There are no English-language immersion programs in publicly-funded elementary-secondary schools in Quebec.
Source: Statistics Canada. Elementary-Secondary Education Survey.
In addition to second-language immersion programs which are aimed at Anglophone students in provinces other than Quebec, all provinces also offer minority-language education programs which are aimed at students whose mother tongue is French in provinces other than Quebec and whose mother tongue is English in Quebec.
Section 23 of the Canadian Charter of Rights and Freedoms states that minority-language schooling will be made available "where numbers warrant." The size of minority-language populations varies widely across the provinces, as does their distribution within provinces. Thus, population density of minority-language children and youth plays a major role in determining whether offering minority-language schooling is feasible in any given location.
Overall, just under 244,000 students were enroled in minority-language education programs in publicly-funded elementary and secondary schools in Canada in 2008/2009. These numbers were highest in Quebec, at almost 99,000, and in Ontario, at close to 92,000.
Canada-wide, the number of students enroled in minority-language programs in publicly-funded elementary and secondary schools decreased by 4% between 2000/2001 and 2008/2009. The largest decrease occurred in New Brunswick which saw enrolments in these programs decrease by 19% over this period, followed by Quebec with a decrease of 6%. In contrast, British Columbia, Alberta and Saskatchewan saw strong increases in minority-language enrolments, at 52%, 40% and 16%, respectively, though it should be noted that these large percentage changes reflect relatively small numbers of students compared to Quebec and Ontario.
Aboriginal language as a course of instruction
The Elementary Secondary Education Survey first began collecting data in 2002/2003 on the number of students who were taking an Aboriginal language as a course of instruction. This includes all students, aboriginal and non-aboriginal, who are attending an off-reserve publicly-funded school.
Between 2002/2003 and 2008/2009, enrolment in such programs increased 3% (excluding Alberta for which data were not available). Excluding Alberta, almost 48,000 students were taking an Aboriginal language as a subject of instruction in 2008/2009. British Columbia reported the largest number of students taking an Aboriginal language as a subject in school, at over 29,000 students in 2008/2009.
Educators
Despite declining enrolments across Canada, the total number of educators (full-time equivalent) has continued to increase. In 2008/2009, there were over 339,000 educators in Canada, up 7% since 2000/2001.
Most provinces and all territories reported increases in the number of full-time equivalent (FTE) educators between 2000/2001 and 2008/2009. The largest increases over this period were in Saskatchewan (37%) and Nunavut (34%). Substantial gains are also evident in Northwest Territories, Alberta and Ontario, at 16%, 13% and 12%, respectively. In contrast, the number of full-time equivalent educators decreased in Newfoundland and Labrador (down 11%) and in Prince Edward Island and British Columbia (both down 7%).
Most provinces and all territories reported increases in the number of full-time equivalent (FTE) educators between 2000/2001 and 2008/2009. The largest increases over this period were in Saskatchewan (37%) and Nunavut (34%). Substantial gains are also evident in Northwest Territories, Alberta and Ontario, at 16%, 13% and 12%, respectively. In contrast, the number of full-time equivalent educators decreased in Newfoundland and Labrador (down 11%), British Columbia (down 7%) and in Prince Edward Island (down 3%).
Student-educator ratio
When considering the student-educator ratio, it is important to note that the term 'educator' refers not only to teachers, but also includes school administrators and pedagogical support staff. Therefore, a decrease in the student-educator ratio does not necessarily imply fewer students per teacher in the classroom, but could reflect an increase in the number of pedagogical staff or administrators in the system.
The student-educator ratio decreased in every jurisdiction between 2000/2001 and 2008/2009, with the exception of British Columbia where it remained relatively unchanged at about 16.4 students per educator (Chart 4). Alberta's student-educator ratio was similar, at 16.5 in 2008/2009, down from 18.2 in 2000/2001.
Most other provinces and territories saw larger decreases in the student-educator ratio over this period, with the ratio falling from about 16 students per educator to 13 to 14 students per educator. In 2008/2009, the lowest student-educator ratios were observed in Yukon (10.1), Saskatchewan (10.6) and Newfoundland and Labrador (12.1).
Chart 4
Student-educator ratio1, by province and territory, 2000/2001 and 2008/2009

1
The term "educator" refers to teachers, school administrators and pedagogical support.
Source: Statistics Canada. Elementary-Secondary Education Survey.
Conclusion
Provincial and territorial ministries of education are constantly faced with the need to adjust to changes in the size and geographical location of the school-aged population. The continuing trend toward a reduction in the size of the school-aged population is part of that challenge, as school boards work to balance the need for facilities in areas where new schools are needed with the need to address the issue of declining school populations in other areas.
At the same time, demand for educational services is growing in other respects. This is especially the case with respect to meeting the growing demand for French-language immersion and minority-language programs in most provinces and for delivering instruction in Aboriginal languages, especially in the Western provinces where the size of the Aboriginal population is relatively large and growing.
There are longer-term consequences, as well. As the numbers of students entering school today decreases, so too will the number of graduates leaving the system over the next decade or so. That, in turn, will have impacts on the number of students eligible to attend postsecondary education in the future and, ultimately, on the number of new labour market entrants.
- Date modified: